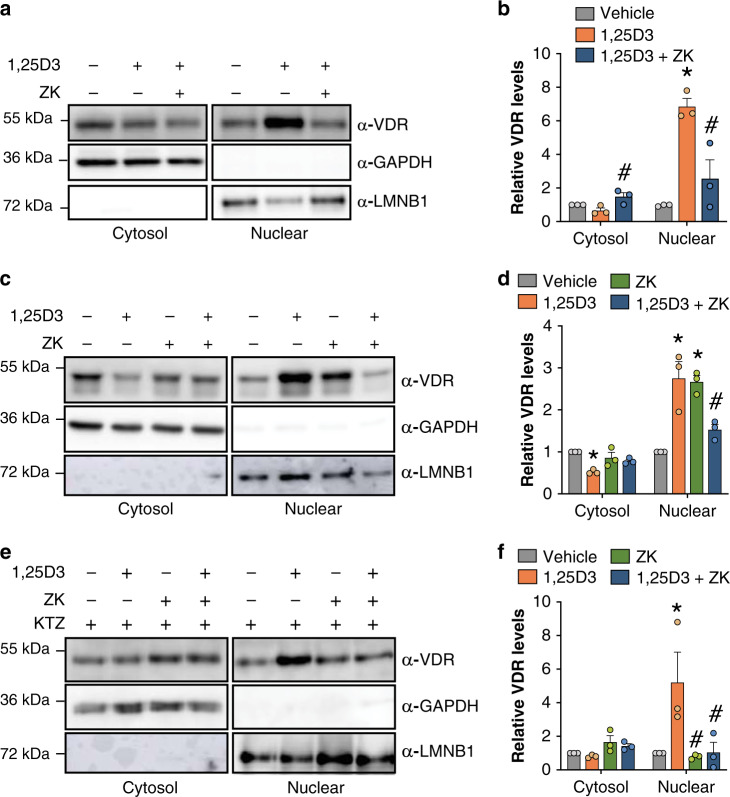
Fig. 3. Ligand-dependent VDR subcellular localization.
Representative immunoblot (a) and quantification (b) of cytosolic and nuclear VDR in FB-789 cells treated for 1.5 h with vehicle, 10 nM 1,25D3, or 10 nM 1,25D3 and 100 nM ZK. GAPDH and LMNB1 were used as internal controls. n = 3 independent biological replicates/condition. Representative immunoblot (c and e) and quantification (d and f) of cytosolic and nuclear VDR in extracts of IEC-18 cells treated for 1.5 h with vehicle, 100 nM 1,25D3, 1 µM ZK, or 100 nM 1,25D3 and 1 µM ZK, pre-treated (e and f) or not (c and d) with 5 µM ketoconazole (KTZ) for 2 h. GAPDH and LMNB1 were used as internal controls. n = 3 independent biological replicates/condition. Unprocessed blots in Source Data. Data in (b), (d), and (f) are represented as mean + s.e.m. *p < 0.05 vs. vehicle, #p < 0.05 vs. 1,25D3; two-way ANOVA with Tukey post-hoc test. The exact significant p-values are provided in Supplementary Table 4.

