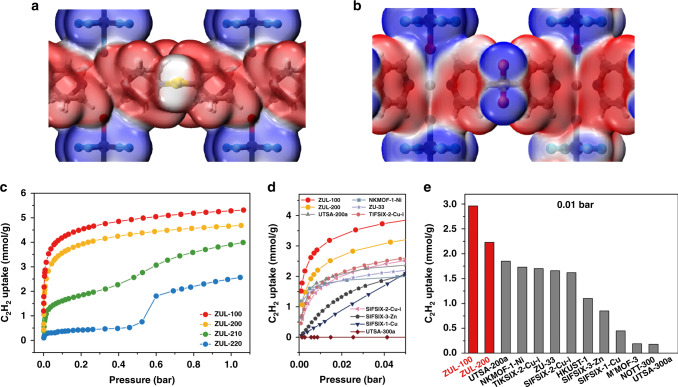
Fig. 2. Surface electrostatic potential and C2H2 adsorption isotherms of the MOFs.
a, b The local surface electrostatic potential of the 2D network in (a) ZUL-220 and (b) ZUL-200 mapped onto the 0.001 a.u. density isosurface with a scale spanning −0.03 a.u. (blue) through 0 (white) to 0.03 a.u. (red). c The C2H2 adsorption isotherms at 298 K for ZUL-100, ZUL-200, ZUL-210, and ZUL-220. d Comparison of C2H2 uptake (0–0.05 bar) among representative MOFs at 298 K. e Comparison of C2H2 uptake (0.01 bar, 298 K) among representative MOFs.

