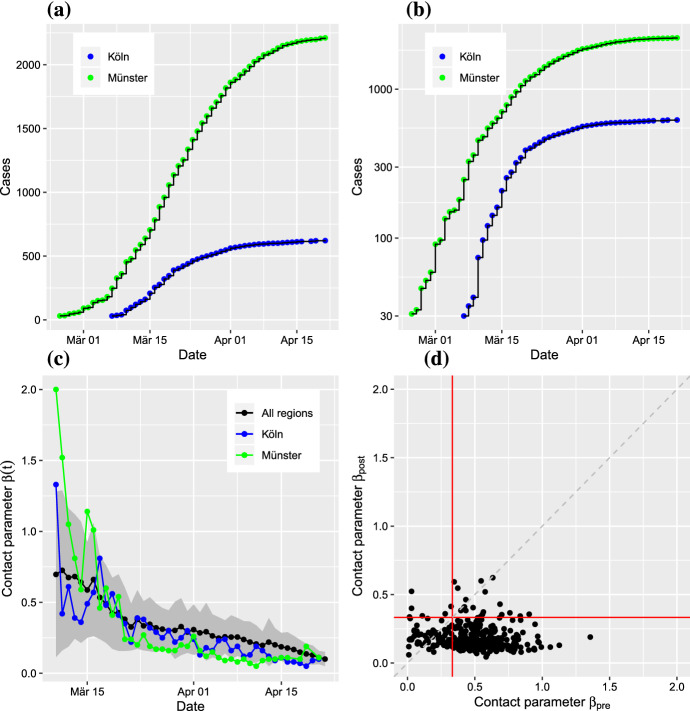
Fig. 4.
(Color figure online) Analysis of best fit time-dependent contact parameters ; date refers to report of case at RKI. a For two regions (LK Köln and LK Münster), the cumulative numbers show a strong increase after different disease onset times. b Semi-logarithmic scaling suggests approximate exponential growth in early as well as later regimes. c The time-dependent contact parameter indicates a small decrease over time due to social distancing interventions (black: average for 320 regions; red, blue: contact parameter for the examples above; gray shading: standard deviation across regions. d Scatter plot of the time averaged contact parameter before intervention and after intervention. Note that the critical value for disease containment is per day in our model (red lines)

