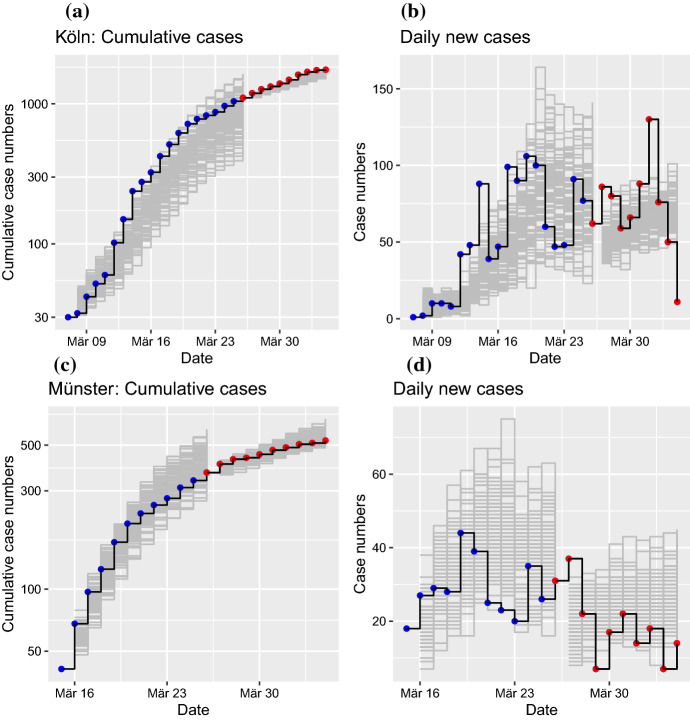
Fig. 5.
(Color figure online) Simulations of the stochastic SEIR model for two example regions. Simulations I indicate an ensemble of 100 runs of the model with initial conditions from the first epidemic day with number of cases greater than or equal to 30 (gray: ensemble of trajectories; blue: observations). Simulations II start at March 26, using an ensemble size of 100 after data assimilation (gray: ensemble of trajectories; red: observations). a Cumulative cases of infected individuals over time for LK Köln. b Daily reported new cases for Köln. c Cumulative cases for LK Münster. d Daily new cases for Münster. Date refers to report of case at RKI

