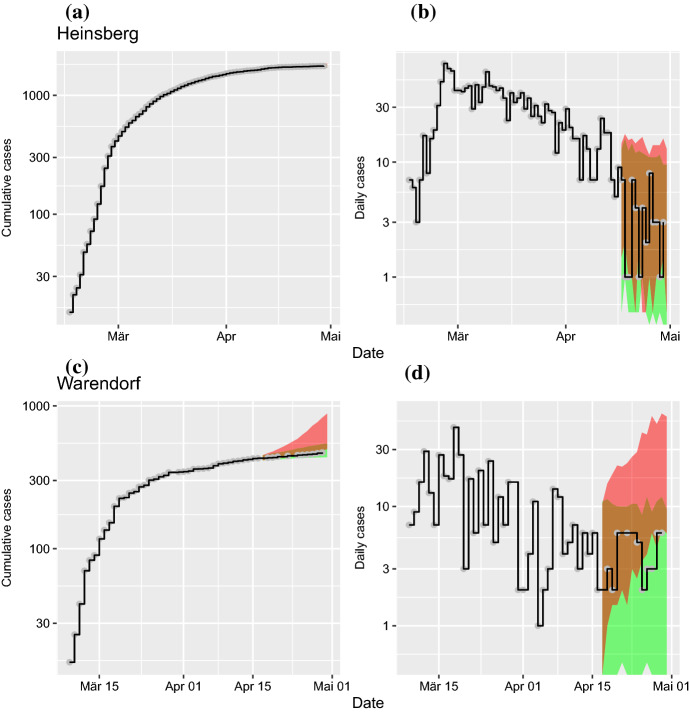
Fig. 6.
(Color figure online) Model predictions for COVID-19 after data assimilation in comparison to data (black lines). In scenario I (green area), an assimilated ensemble of internal model states starts the forecast with contact parameter (continuation of social distancing interventions). In scenario II (red area), the equivalent forecast is generated with contact parameter (termination of interventions). a Predictions for cumulative case numbers in Heinsberg. b Predictions of daily new cases in Heinsberg. c Predictions of cumulative cases for Warendorf. d Predictions of daily new cases for Warendorf. Date refers to report of case at RKI

