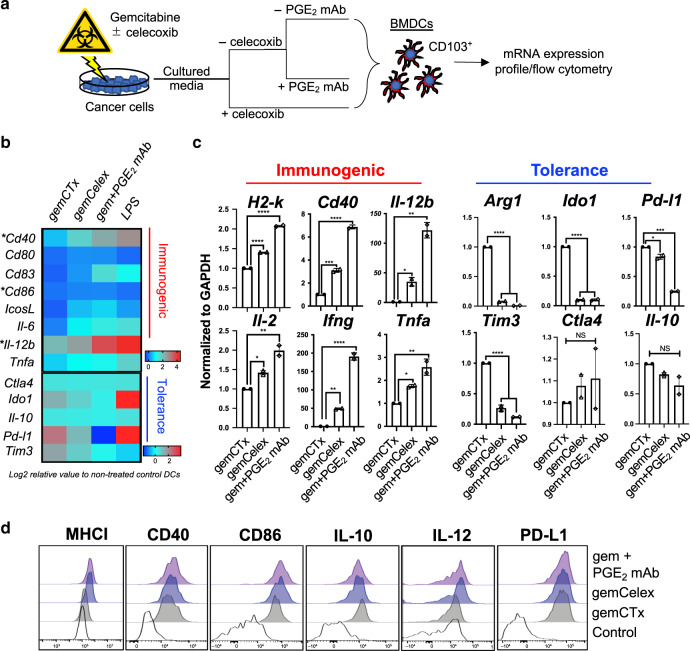
Fig. 4. An inhibitory signal 0 counteracts DAMPs to mitigate immunogenic dendritic cell maturation.
a A schematic depicting the workflow utilized to assay CD103+ BMDC activation: CD103+ BMDCs were incubated with cultured media from cancer cells pre-treated with gemcitabine ± iDAMP blockade in vitro. PGE2 neutralizing antibody or celecoxib were implemented as independent approaches to block PGE2 action. b Heat-map derived from Fluidigm Biomark™ analyzing surrogate genes representing CD103+ BMDC activity that were collected from a. Log2 values were calculated from normalized ct values of non-treated CD103+ BMDCs as baseline control. c qPCR validating genes associated with immunogenic versus tolerogenic dendritic cells. Relative mRNA expression was normalized to Gapdh and to gemCTx-treated CD103+ BMDCs (representative plot shown with two technical replicates of n = 3 independent experiments). d Representative flow cytometry histogram plots of CD103+ BMDCs 24 h post-cultured media treatment (n = 3 independent experiments; example gating depicted in Supplementary Fig. 7). mAb monoclonal antibody, NS statistically non-significant. Statistics: two-tailed, one-way ANOVA-Tukey’s multiple comparisons test (H2-k; p < 0.0001), (Cd40; ***p = 0.0002 and ****p < 0.0001), (Il-12b; *p = 0.0475 and **p = 0.0013); (Il-2; *p = 0.323 and **p = 0.0069), (Ifng; **p = 0.0017 and ****p < 0.0001), (Tnfa; *p = 0.0347 and **p = 0.0024), (Arg1; p < 0.0001), (Ido1; p < 0.0001), (Pd-l1; *p = 0.0103 and ***p = 0.0001), (Tim3; p < 0.0001); and where appropriate, data are presented as mean values ±SEM.

