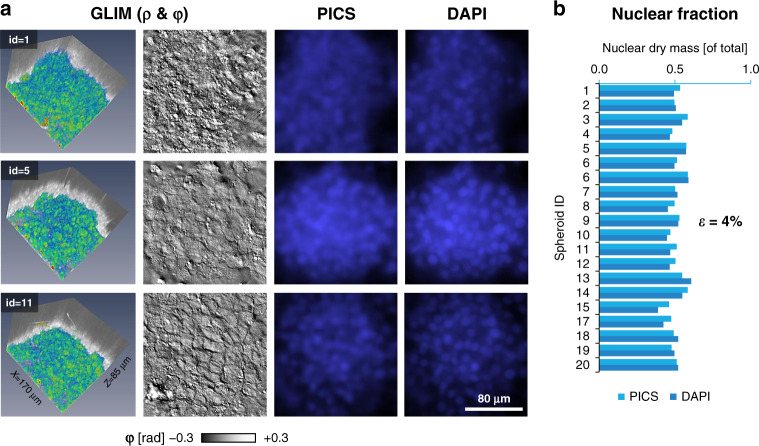
Fig. 6. PICS for digitally staining 3D cellular systems.
a Representative images of PICS applied to HepG2 spheroids (×63/1.4, 170 μm × 170 μm × ~85 μm). The scattering potential, GLIM (ρ) was recovered, as in the original GLIM paper, by nonlinear filtering where the absolute value of the phase map is displayed on a log scale. PICS and DAPI insets were bilaterally filtered to improve contrast. b To compare the performance of PICS to conventional DAPI staining we constructed a semantic segmentation map by thresholding the DAPI and PICS image and calculating the dry mass within this map. When comparing total dry mass across twenty samples, we find the average percentage change between the PICS and DAPI images to be 4%.

