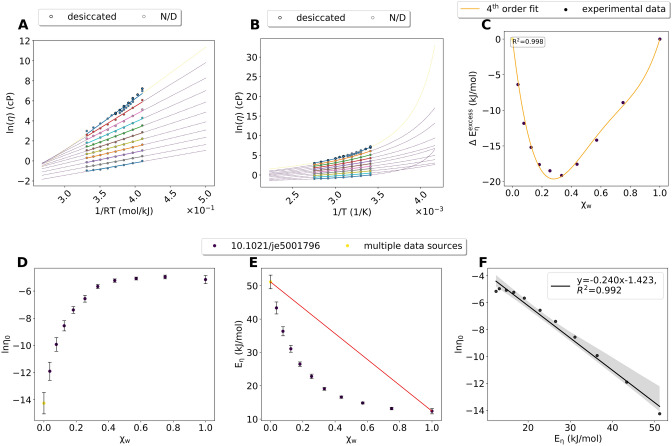
Figure 1.
Reline–water mixtures. (A) Arrhenius fits (using a minimum of 3 data points). Dots and thick lines are the experimental data and the respective fit. The dashed lines are extensions of the fit. Colors of the dashed lines indicate the source of the data. Yellow: multiple data points from different sources were be combined. (B) VFT fits using a minimum of 4 data points. (C) calculated based on the red line in (E). Colors of the data points indicate the source of the data. (D) lnη0 at different χw. Error bars are calculated based on the fit in (A). Colors of the dashed lines indicate source of the data. (E) Eη at different χw. The red line indicates the behavior of an ideal binary mixture and was used to calculate . (F) Correlation between lnη0 and Eη.

