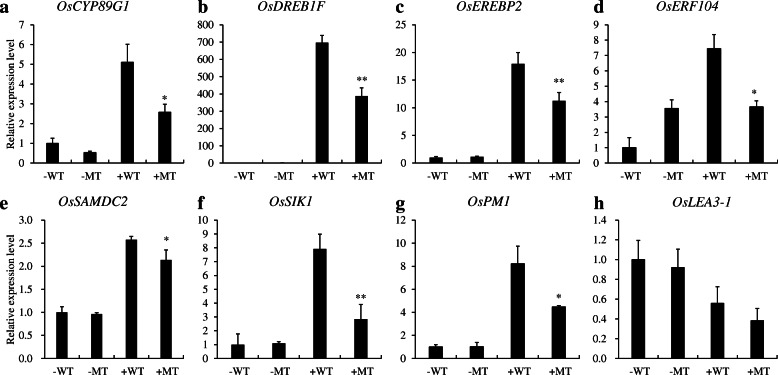
Fig. 8.
Relative expression levels of eight possible DEGs in MT (osnac45-knockout) and WT (Nipponbare) roots under normal conditions and high salinity. OsCYP89G1 (a), OsDREB1F (b), OsEREBP2 (c), OsERF104 (d), OsSAMDC2 (e), OsSIK1 (f), OsPM1 (g), OsLEA3–1 (h). -WT and -MT indicate Nipponbare and OsNAC45-knockout lines under control conditions. +WT and + MT represent Nipponbare and OsNAC45-knockout lines treated with 100 mM NaCl for 24 h, respectively. Data are means ± SD of three biological replicates. *P < 0.05, **P < 0.01 by Student’s t test

