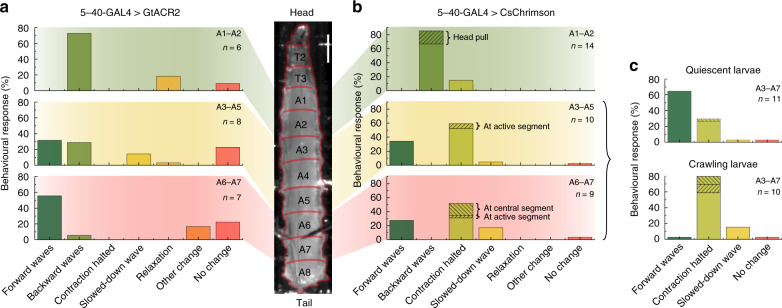
Fig. 4. Behavioural response upon local inhibition/activation of sensory neurons using a microstructured OLED.
a 5–40-GAL4 > GtACR2 larvae illuminated at segments A1–A2 (top), A3–A5 (centre) and A6–A7 (bottom). Illumination pulses lasted 10 s and used three neighbouring OLEDs. n, number of larvae tested. b 5–40-GAL4 > CsChrimson larvae illuminated at segments A1–A2 (top), A3–A5 (centre) and A6–A7 (bottom). Illumination pulses lasted 3 s and used a single OLED pixel. c Behaviour of 5–40-GAL4 > CsChrimson larvae upon illumination of segments A3–A7, discriminating between larvae that were quiescent before stimulation (top) and larvae that were previously crawling (bottom). Scale bar: 500 µm. Light intensity: 15 µW mm−2.

