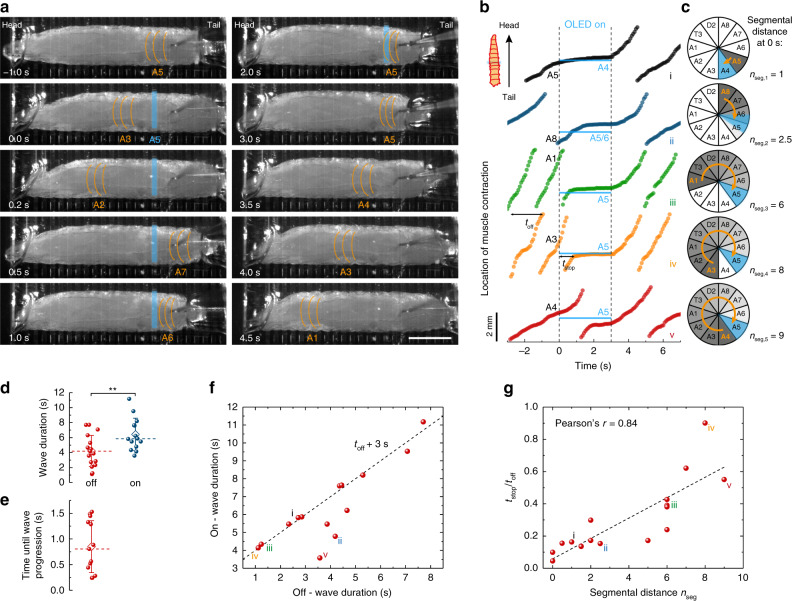
Fig. 5. Local optical halting of muscle contraction waves upon sensory neuron activation in CsChrimson-expressing larvae.
Larvae were stimulated at posterior segments A3–A7 with one OLED pixel at a light intensity of 15 µW mm−2 for 3 s. a Representative time lapse indicating the active larval segment with orange lines in each frame. Active OLED pixel located at A5 as indicated in blue. Scale bar: 1 mm. See Supplementary Movie 4 for complete time lapse and trace iv (orange) in b for further analysis. b Location of forward muscle contraction waves over time. The location of the active OLED and of the illuminated larval segment is indicated in blue. The segment that was contracted at the time of light turn-on (at 0 s) is indicated in black. Data shown were collected from four different larvae. c Polar graphs illustrate the progress of muscle contraction waves between the time of OLED turn-on and the wave coming to a local halt. The contracted segment at OLED turn-on marked in orange; illuminated segment marked in blue. Segmental distance, nseg, represents the number of segments between the segment contracted at the time of light turn-on and the stimulated segment. d Statistical comparison of wave duration for OLED off and on. During on-time, wave durations were significantly longer (P = 0.008, two-tailed t test) than during off-time. Whiskers: SD; diamond: mean; dashed line: median. e Statistical analysis of time elapsed between light turn-off and the progression of the muscle contraction wave. f Relation between durations of contraction wave under illumination, ton, and in the dark, toff. Dashed line: ton = toff + 3 s. g Time that elapsed between light turn-on and pausing of muscle contraction wave, tstop, over toff as a function of nseg (nseg as defined in c). Roman numbers i–v in f and g indicate the corresponding graphs in b. n = 6 larvae with ≥13 stimulations for d–g.

