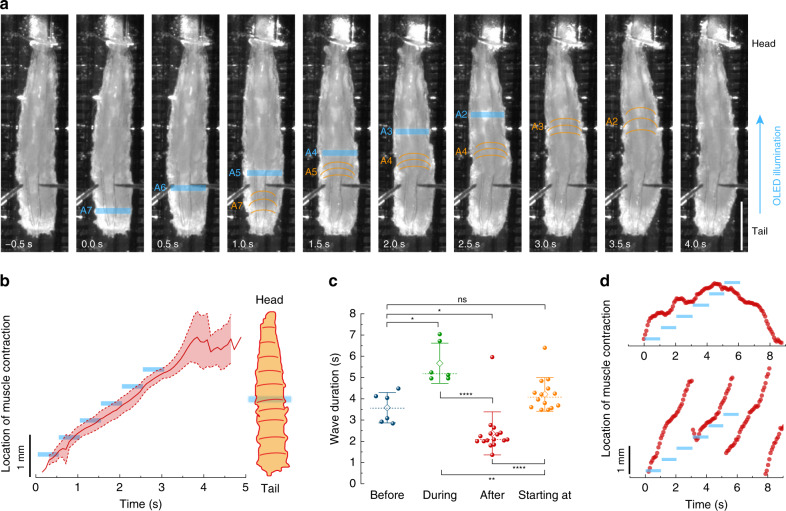
Fig. 7. Response of 5–40-GAL4 > CsChrimson larvae to wave-like optical stimulation from posterior to anterior.
a Representative time-lapse images. The contracted larval segment is indicated by orange lines in each frame. Active OLED pixels are indicated in blue. Scale bar: 1 mm. See Supplementary Movie 6 for complete time lapse. b Overlay traces showing mean ± SD of the location of muscle contraction waves over time. The timing and location of the active OLED pixel are indicated by blue bars. n = 3 larvae, nine stimulations. c Wave durations grouped by start and end time of the wave relative to the optical stimulation. Before: wave ended before optical illumination. During: wave started before illumination and ended after illumination ceased. After: wave started after illumination. Starting at: wave started during illumination. n = 4 larvae. Two-tailed t test: n.s. not significant (P > 0.05), *P < 0.05, **P < 0.01, ****P < 0.0001. Whiskers: SD; diamond: mean; dashed line: median. d Two representative traces showing the location of muscle contraction in response to slowed-down wave-like stimulation. Light intensity: 30 µW mm−2.

