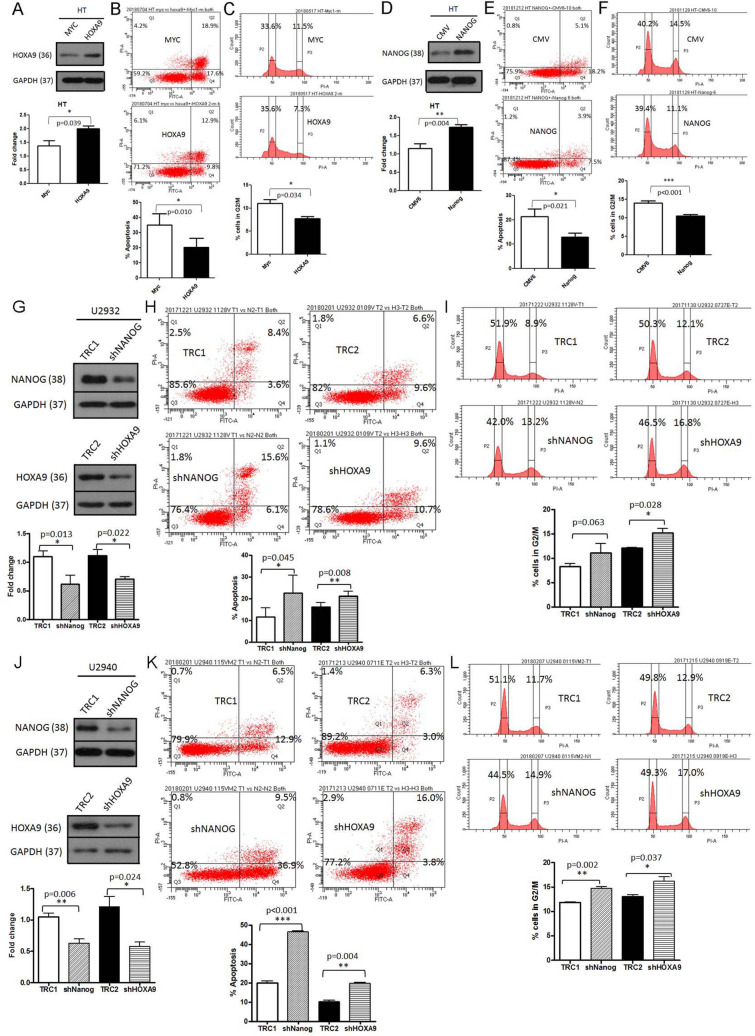
Figure 3.
Expression of stem cell markers NANOG and HOXA9 affects DLBCL G2/M cell cycle arrest and apoptosis. (A)–(F) Transfection of HOXA9 (A–C) and NANOG (D-F) decreases cell apoptosis and decreases G2/M phase cell cycle arrest in DLBCL HT cells. (A) HT cells were transfected with HOXA9 and cultured for 48 h and then evaluated by Western blotting which showed significantly higher expression. (B) HT cells were stained with annexin V (Q2 + Q4) and analyzed by flow cytometry. Representative histograms depict a decrease of cell apoptosis with HOXA9 transfection (MYC, 36.5% vs HOXA9, 22.7%). (C) Representative flow histograms depict decreased G2/M cell cycle arrest after HOXA9 transfection (MYC, 11.5% vs HOXA9, 7.3%). Quantitation of G1/S and G2/M fractions in HT cells after 48 h culture post HOXA9 transfection. (D) HT cells were transfected with NANOG and cultured for 48 h, and then evaluated by Western blotting which showed significantly higher expression. (E) HT cells were stained with annexin V (Q2 + Q4) and analyzed by flow cytometry. Representative histograms depict decrease of cell apoptosis with NANOG transfection (CMV, 23.3% vs NANOG, 11.4%). (F) Representative flow histograms show decreased G2/M cell cycle arrest after NANOG transfection (CMV, 14.5% vs NANOG, 11.1%). Quantitation of G1/S and G2/M fractions in HT cells after 48 h culture post NANOG transfection. (G)–(L) Knock-down of NANOG or HOXA9 increases cell apoptosis and causes G2/M phase cell cycle arrest in DLBCL cells (G-I, U2932; J-L, U2940). (G) Attenuated expression of NANOG or HOXA9 in U2932 cells after culture for 48 h, and then evaluated by Western blotting showing significantly lower expression. (H) U2932 cells were stained with annexin V (Q2 + Q4) and analyzed by flow cytometry. Representative histograms depict increased cell apoptosis following knockdown of NANOG or HOXA9 (TRC1, 12.0% vs shNANOG, 21.7%; TCR2, 16.2% vs shHOXA9, 20.3%). (I) Representative flow histograms show increased G2/M cell cycle arrest after knockdown of NANOG or HOXA9 (TRC1, 8.9% vs shNANOG, 13.2%; TCR2, 12.1% vs shHOXA9, 16.8%). Quantitation of G1/S and G2/M fractions in U2932 cells after 48 h culture post knockdown of NANOG or HOXA9. (J) Attenuated expression of NANOG or HOXA9 in U2940 cells cultured for 48 h and then evaluated by Western blotting showing significantly lower expression. (K) U2940 cells were stained with annexin V (Q2 + Q4) and analyzed by flow cytometry. Representative histograms depict an increase of cell apoptosis with knockdown of NANOG or HOXA9 (TRC1, 19.4% vs shNANOG, 46.4%; TCR2, 9.3% vs shHOXA9, 19.8%). (L) Representative flow histograms illustrate increased G2/M cell cycle arrest after knockdown of NANOG or HOXA9 (TRC1, 11.7% vs shNANOG, 14.9%; TCR2, 12.9% vs shHOXA9, 17.0%). Quantitation of G1/S and G2/M fractions in U2940 cells after 48 h culture post knockdown of NANOG or HOXA9. The experiment was repeated in triplicate and merged data from all the experiments are shown. *p < 0.05, **p < 0.01, ***p < 0.001, Student paired t-test.

