Figure 4.
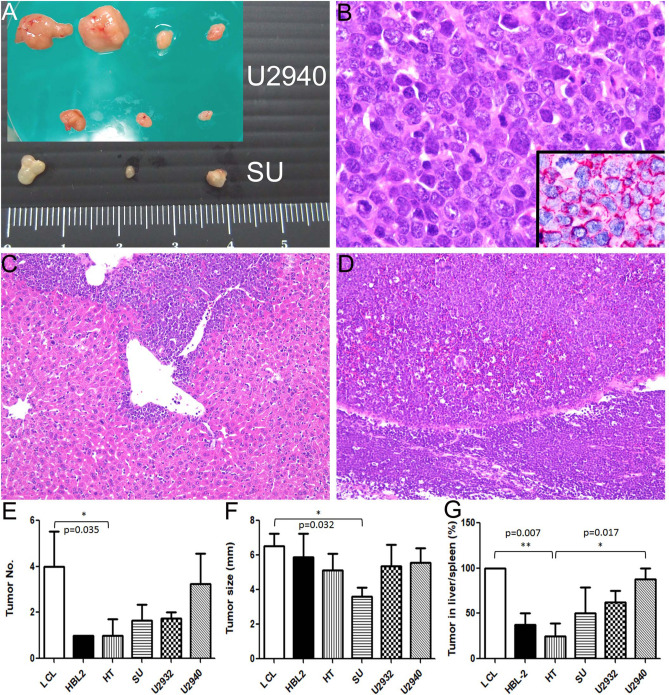
Xenograft mouse model shows larger and a greater number of tumor nodules as well as more frequent hepatosplenic infiltration in cell lines with higher expression of NANOG and HOXA9. (A) U2940 cells formed larger and more tumor nodules. (B) Histologically, the U2940 xenograft is composed of large lymphoid cells with a brisk mitotic activity (HE stain, 1000X) and CD20 positivity (1000X). (C), (D) The DLBCL cells inoculated via the tail vein show dense infiltration in the liver (upper in C, HE stain, 200X) and spleen (lower in D, HE stain, 200X). (E) The mean xenograft tumor numbers in each mouse are depicted for six cell lines (LCL, 4; HBL-2, 1; HT, 1; SU, 1.7; U2932, 1.8; U2940, 3.3). (F) The mean tumor size (mm) in each cell line group (LCL, 6.5; HBL-2, 5.9; HT, 5.1; SU, 3.6; U2932, 5.4; U2940, 5.6). (G) The mean frequency of hepatosplenic infiltration in each cell line group (LCL, 100%; HBL-2, 38%; HT, 25%; SU, 50%; U2932, 67%; U2940, 88%). The detailed data are listed in Supplementary Table S3. *p < 0.05, **p < 0.01, Student t-test.

