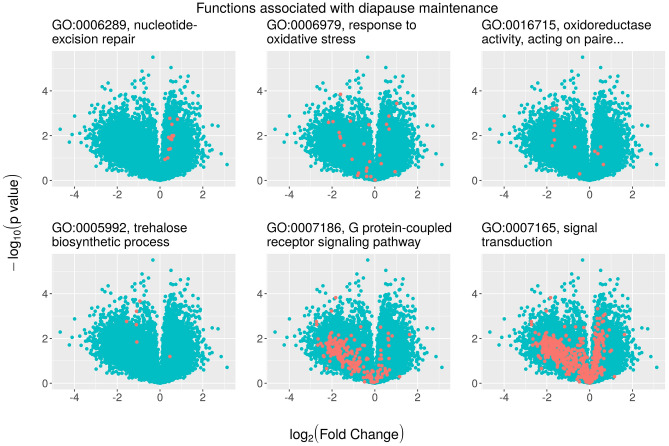
Figure 3.
Volcano plots (statistical significance vs. fold change, FC) showing differential gene expression associated with selective regimes for different gene ontology (GO) specific terms related to diapause maintenance (see text for description). Each point is a separate gene. The red dots highlight genes included in each particular GO pathway (see headings) over the entire set of differentially expressed genes among regimes. In all plots, positive values of log2-FC indicate upregulation in the unpredictable regime. If log2(FC) is negative, gene expression is higher in the predictable regime.

