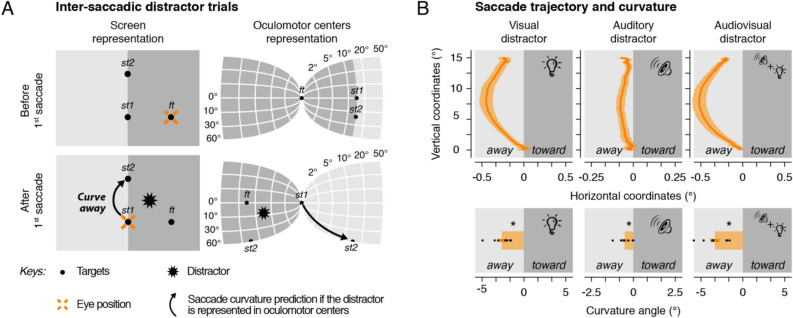
Figure 2.
Inter-saccadic distractor trials. (A) Screen (left panels) and oculomotor centers (right panels) representation of the targets (black dots), the eye position (cross), the distractor (star) and the saccade curvature prediction (arrow) before (top panels) and after (bottom panels) the first horizontal saccade. If the distractor is represented in oculomotor centers, we predicted that the second saccade would curve away from the distractor screen position. (B) Averaged normalized second saccade trajectory (top panels) and curvature angle (bottom panels) observed following the presentation of a visual (left panels), an auditory (center panels), or an audiovisual (right panels) inter-saccadic distractor in Exp.1. Saccade trajectories are rotated in order to have upward saccades and negative x-values representing coordinates away from the screen position of the distractor. Areas around the averaged saccade trajectory and error bars represent SEM. Black dots show individual participants. Asterisk indicates a significant effect (p < 0.05, ns: non-significant). Note that we illustrated two known features of oculomotor centers: cortical magnification factor (see logarithmic scale) and the double visual inversion (left–right and top–bottom) relative to the screen representation.

