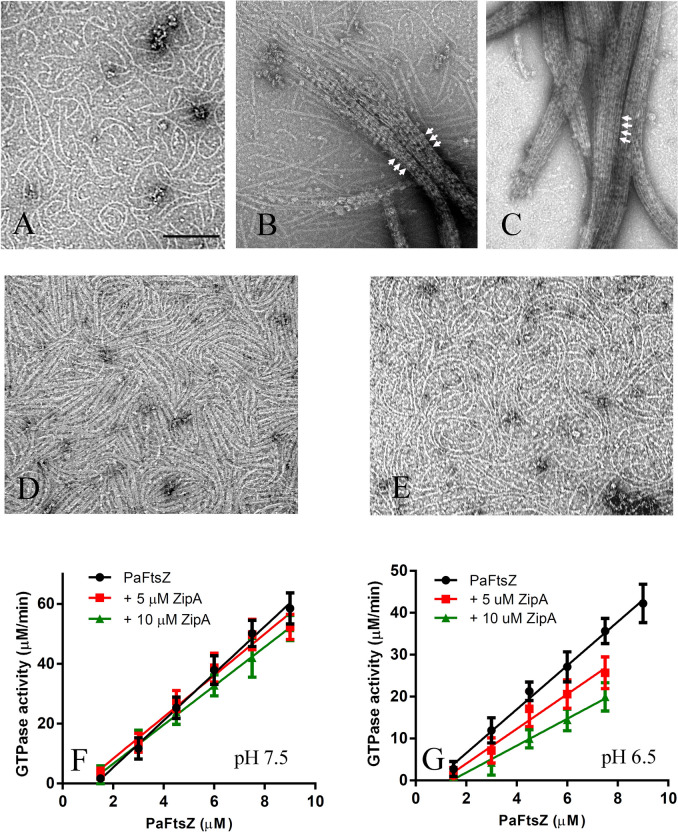
Figure 2.
PaFtsZ assembly in the presence of ZipA. (A–E) shows negative stain EM of 5 µM PaFtsZ and 10 µM ZipA in HMK buffer (A), in MMK buffer (B,C), in MEK buffer (D) and in HEK buffer (E). PaFtsZ-ZipA assembled into the huge bundles in MMK buffer; periodic striations (arrows) may be ZipA crosslinks. The bar represents 200 nm and all EM images have the same magnification. (F–G) shows the GTPase activity of PaFtsZ in the presence of ZipA in HMK buffer (F) and MMK buffer (G).

