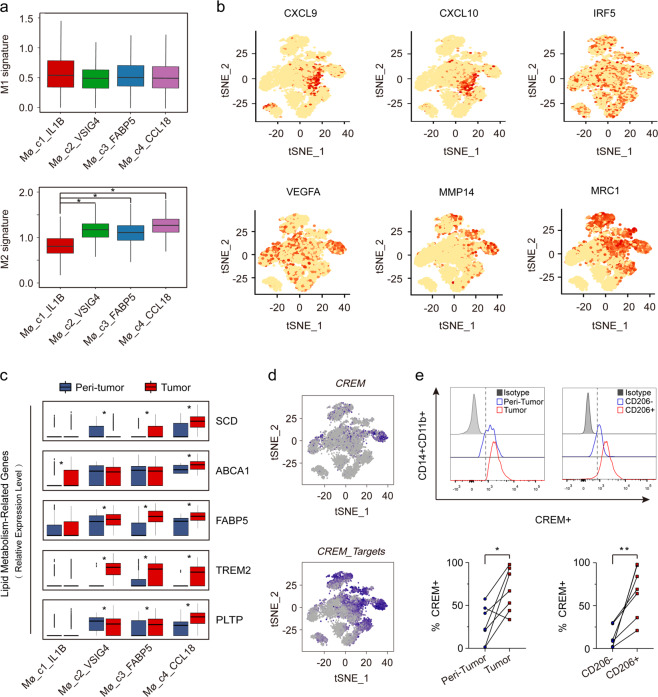
Fig. 3. Transcriptome heterogeneity of four subsets of macrophages.
a Module scores of M1 and M2 expression signatures defined by Azizi et al.14 (Genes list in Supplementary Table S5) for each macrophage subset at single-cell level. *P < 0.01. b t-SNE plots of M1 (top) and M2 (bottom) expression signatures. c The expression of lipid metabolism-related genes plotted via boxplots. *P < 0.01. d t-SNE plots for the expression of CREM and regulation of its target genes. e Representative flow cytometry plots (top) and statistics (bottom) of CREM expression in CD14+CD11b+ macrophages from HCC tumor or peri-tumor, and CD14+CD11b+CD206− or CD14+CD11b+CD206+ macrophages. Data analyzed by wilcoxon matched-pairs signed rank test. *P < 0.05, **P < 0.01.

