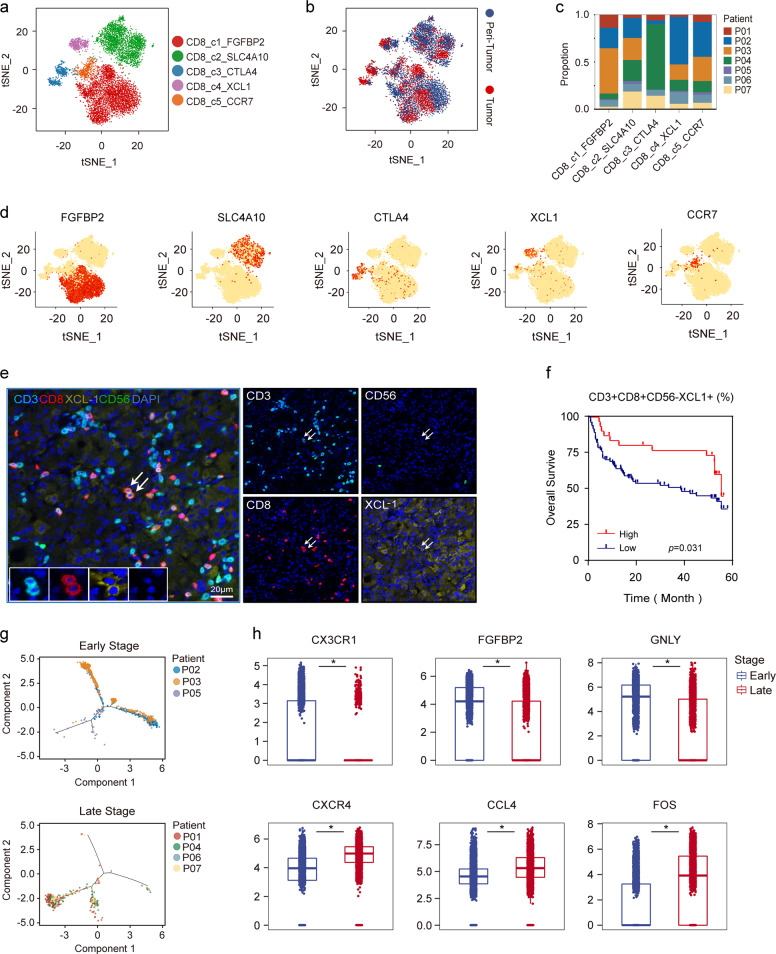
Fig. 5. Infiltration of diverse CD8+ T-cell subsets in HCC.
a t-SNE projection of all CD8+ T cells showed in different colors. b t-SNE plots of different subsets of CD8+ T-cell origin. c Proportions of five clusters in each patient. d Expression of marker genes for each cluster illustrated in the t-SNE plots. e Multicolor IHC staining to validate the existence of CD3+CD8+CD56−XCL1+ T cells in HCC TME, white arrows (CD3+CD8+CD56−XCL1+). Scale bar, 20 μm. f Kaplan–Meier curve showing decreased survival in patients with low proportion of CD3+CD8+CD56−XCL1+ T cells (Log-rank test) in our cohort (Supplementary Table S4). g Pseudotime trajectory of early-stage or late-stage CD8_c1 T cells demonstrated in the trajectory. h Expression of selected genes in early-stage and late-stage HCC are shown in the boxplots. *P < 0.01.

