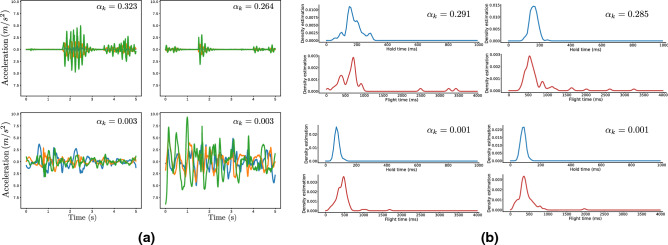
Figure 3.
Visualization of bag instances that receive the highest and lowest attention weights by the proposed model. Figures were drawn using Inkscape v1.0 https://inkscape.org/. (a) View of the tri-axial (x-axis: blue, y-axis:orange, z-axis: green) accelerometer segments corresponding to the two highest (top row) and two lowest (bottom row) attention weights assigned by the model, for a PD subject that exhibits tremor. As we can see, the model assigns larger attention weights ak to the acceleration segments that contain sinusoidal components in the PD tremor frequency band of 3–8Hz (top row) and low weights to segments that lack such patterns (bottom left) or whose frequency content is outside the target frequency band (bottom right). (b) View of the hold and flight time histograms (smoothed for visualization purposes via a kernel-density estimator) corresponding to the two highest (top row) and two lowest (bottom row) attention weights for a PD subject that exhibits FMI. Notice how the model assigns large attention weights to typing sessions in which the hold and flight time distributions are multi-modal and shifted towards regions of slower typing, in contrast to the sessions that receive little attention and in which the distributions are unimodal and located at regions of faster typing.

