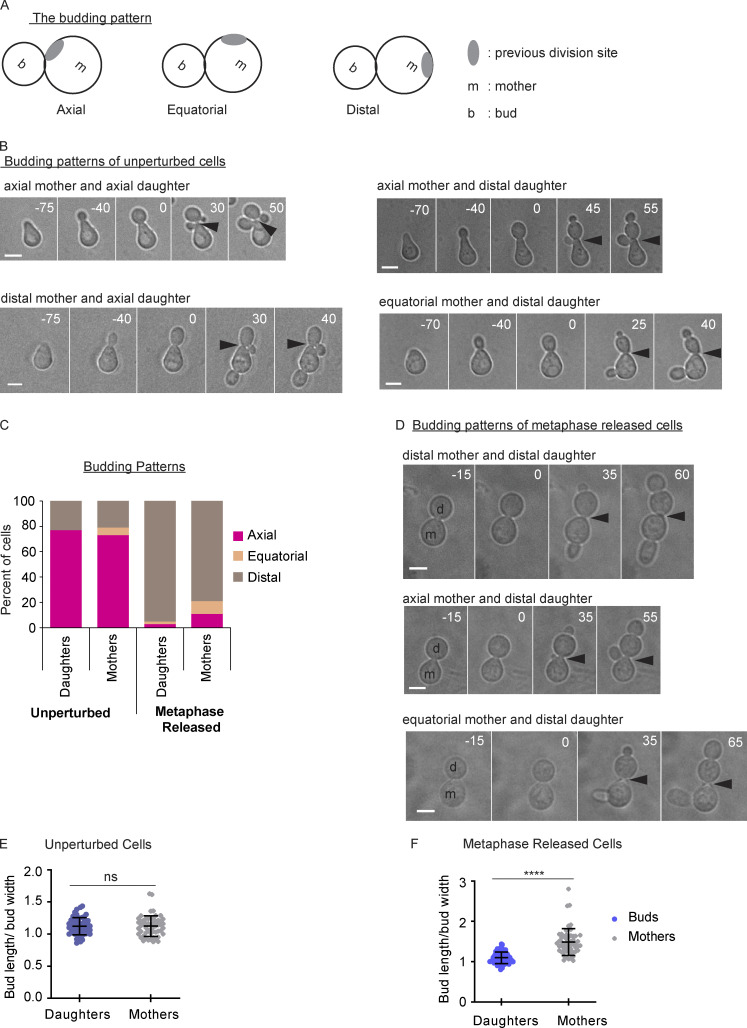
Figure S4.
Altered budding pattern after prolonged metaphase arrest. (A) A cartoon showing budding patterns. (B) Representative images of budding patterns in unperturbed cell cycle. Cells were released from α factor. Numbers indicate time in minutes, with time 0 indicating the time of spindle breakdown in the first division cycle after α factor release. Scale bars, 5 µm. Arrowheads indicate the previous division site. (C) Distribution of budding patterns in an unperturbed cell cycle and from cells released from a metaphase arrest (n = 100 cells from two experiments for each treatment). (D) Representative images of budding patterns in metaphase-released cells. Cells were first released from α factor and arrested at metaphase by depleting Cdc20 using a methionine-repressible promoter. After 3 h, cells were released from the metaphase arrest. Numbers indicate time in minutes, with time 0 showing the time of spindle breakdown in the first division cycle after α factor release. Scale bars, 5 µm. Arrowheads indicate the previous division site. (E) Measurements of the bud length divided by the bud width in both the mother and daughter cells (buds) in an unperturbed cell cycle. Error bars indicate SD (n = 55 cells from two experiments). ns, not statistically significant (Mann-Whitney t test). (F) Measurements of the bud lengths divided by the bud width from both the mother and daughter cells (buds) in cells released from a metaphase arrest (n = 55 cells from two experiments). Error bars indicate SD. ****, P < 0.0001 (Mann-Whitney t test).

