Figure S5.
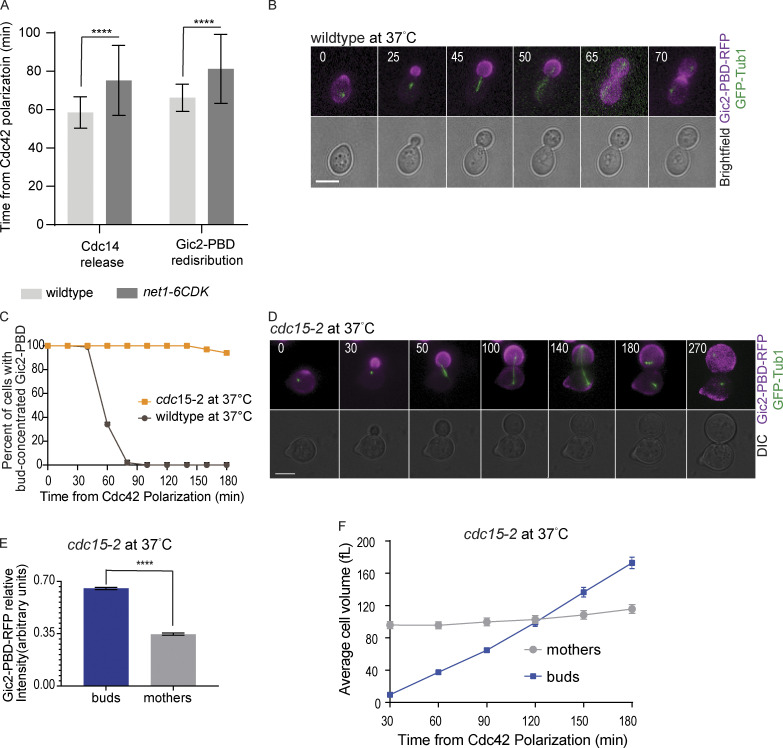
Gic2-PBD localization in cdc15-2 mutant cells. (A) The timing of Cdc14 release and Gic2-PBD redistribution in wild-type and net1-6cdk cells. The time was measured from the initial GTP-Cdc42 polarization (n = 30 cells). Error bars indicate SD. Asterisks indicate statistically significant differences (****, P < 0.0001, Mann-Whitney t test). (B) Representative time-lapse images showing GFP-Tub1 and Gic2-PBD in a wild-type cell incubated at 37°C. Numbers indicate time in minutes from the initial GTP-Cdc42 polarization in G1. Scale bar, 5 µm. (C) Percentage of cells with Gic2-PBD concentrated in the buds of wild-type and cdc15-2 cells incubated at 37°C (n = 100 cells for each background from three experiments). (D) Representative time-lapse images showing GFP-Tub1 and the Gic2-PBD in a cdc15-2 cell incubated at 37°C (restrictive temperature). Numbers indicate time in minutes from the initial GTP-Cdc42 polarization in G1. Scale bar, 5 µm. (E) Gic2-PBD-RFP fluorescence intensity in cdc15-2 cells incubated at 37°C for 3 h. Average intensity in each cell compartment was normalized to the total intensity in the cell (n = 50 cells from three experiments; average ± SEM). Asterisks indicate statistically significant differences (****, P < 0.0001, Mann-Whitney t test). (F) Average cell volume in cdc15-2 cells incubated at 37°C (n = 30 cells for each time point from three experiments; average ± SEM). DIC, differential interference contrast.

