Figure 4.
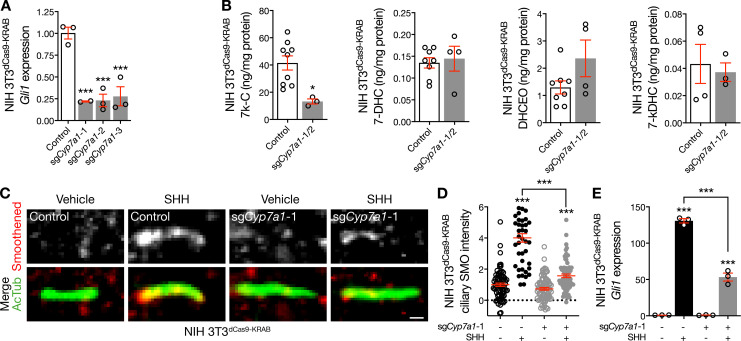
CYP7A1 activates the Hedgehog pathway. (A) qRT-PCR assessment of Gli1 expression in NIH 3T3dCas9-KRAB cells after transduction of sgCyp7a1 compared with control demonstrates inhibition of the Hedgehog transcriptional program after Cyp7a1 suppression (ANOVA). (B) Mass spectrometry–based sterolomics reveal reduced expression of 7k-C and no change in 7-DHC or 7-DHC oxidation by-products in NIH 3T3dCas9-KRAB cells transduced with sgCyp7a1 compared with control (Student’s t test). (C and D) Quantitative immunofluorescence confocal microscopy for Smoothened in relation to the ciliary protein acetylated tubulin (AcTub) in NIH 3T3dCas9-KRAB cells after transduction of sgCyp7a1 demonstrates that Cyp7a1 suppression fails to block Smoothened accumulation in cilia in response to SHH compared with either control cells treated with vehicle or cells expressing sgCyp7a1 treated with vehicle (ANOVA, Student’s t test). Scale bar, 1 µm. Dotted lines denote average background intensity. (E) qRT-PCR assessment of Gli1 expression in NIH 3T3dCas9-KRAB cells after transduction of sgCyp7a1 reveals that Cyp7a1 repression attenuates the Hedgehog transcriptional program in response to SHH (ANOVA). *, P ≤ 0.05; ***, P ≤ 0.001. Error bars represent SEM. The sample size of each experiment is represented by the number of independent data points on each graph. Each experiment is representative of at least three independent biological replicates.

