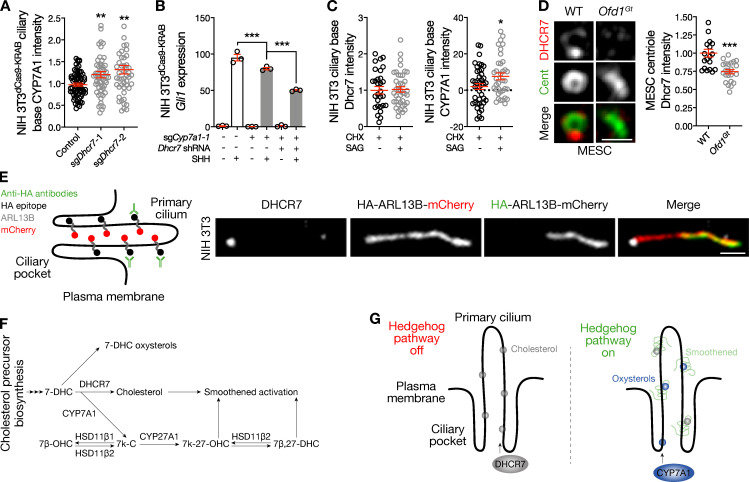
Figure 5.
DHCR7 and CYP7A1 cooperate to activate the Hedgehog pathway near the ciliary base. (A) Quantitative immunofluorescence confocal microscopy for CYP7A1 in NIH 3T3dCas9-KRAB cells shows that Dhcr7 suppression leading to Hedgehog pathway activation accumulates CYP7A1 near the ciliary base (ANOVA). (B) qRT-PCR assessment of Gli1 expression in NIH 3T3dCas9-KRAB cells transduced with sgCyp7a1 and shRNAs targeting Dhcr7 reveals that concurrent suppression of Cyp7a1 and Dhcr7 attenuates the Hedgehog transcriptional program greater than suppression of either enzyme alone in response to SHH (ANOVA). (C) Quantitative immunofluorescence confocal microscopy for DHCR7 and CYP7A1 in NIH 3T3 cells treated the translation inhibitor CHX cells shows that protein synthesis is required to remove DHCR7 from the ciliary base, but is not required to accumulate CYP7A1 at the ciliary base, in response to Hedgehog pathway activation with SAG (Student’s t test). (D) Quantitative immunofluorescence confocal microscopy for DHCR7 in WT and Ofd1Gt mouse embryonic stem cells (MESCs) reveals disruption of centriole structure, as marked by centriolin (Cent), reduces DHCR7 localization near the ciliary base. Scale bar, 1 µm (Student’s t test). (E) Superresolution microscopy and the IN/OUT assay using NIH 3T3 cells stably expressing ARL13B with extracellular HA and intracellular mCherry tags validates DHCR7 localization near the ciliary base. Scale bar, 1 µm. (F) Network of Smoothened-activating sterol and oxysterol biosynthesis constructed from the data in this paper and published literature (Raleigh et al., 2018). (G) Model of lipid enrichment in the ciliary microenvironment and regulation of lipids in response to Hedgehog pathway activity. *, P ≤ 0.05; **, P ≤ 0.01; and ***, P ≤ 0.001. Error bars represent SEM. The sample size of each experiment is represented by the number of independent data points on each graph. Each experiment is representative of at least three independent biological replicates.

