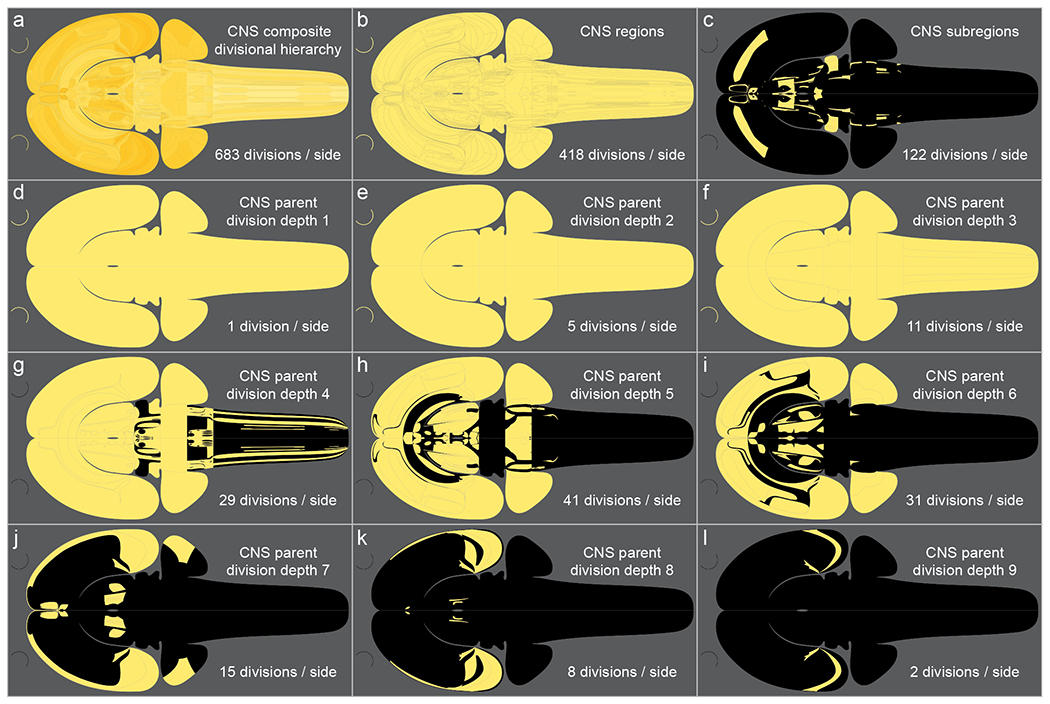
Figure 2.

Flatmap representation of the nested divisional hierarchy of the rat central nervous system (CNS), following Brain Maps 4.0 (Swanson, 2018), and used here in RtBF5. The top left panel (a) shows the composite CNS divisional hierarchy, comprised of 143 parent divisions (above the level of gray matter region), 418 gray matter regions, and 122 subregions (for each side—left and right—of the CNS; excepting divisions that are cortical lamina). The tiles for each division are delineated, and semi-transparent to create an impression of the depth of nesting. Panels b-l represent the individual hierarchical divisions of the CNS: Panels b and c represent (respectively) gray matter regions, and subregions; panels d-l represent each of the 9 depths of CNS parent division. Yellow shading indicates the presence of a given division, whereas a black background indicates its absence. The two curved lines to the left of each panel represent the retina (a gray matter region division of the hypothalamus).
