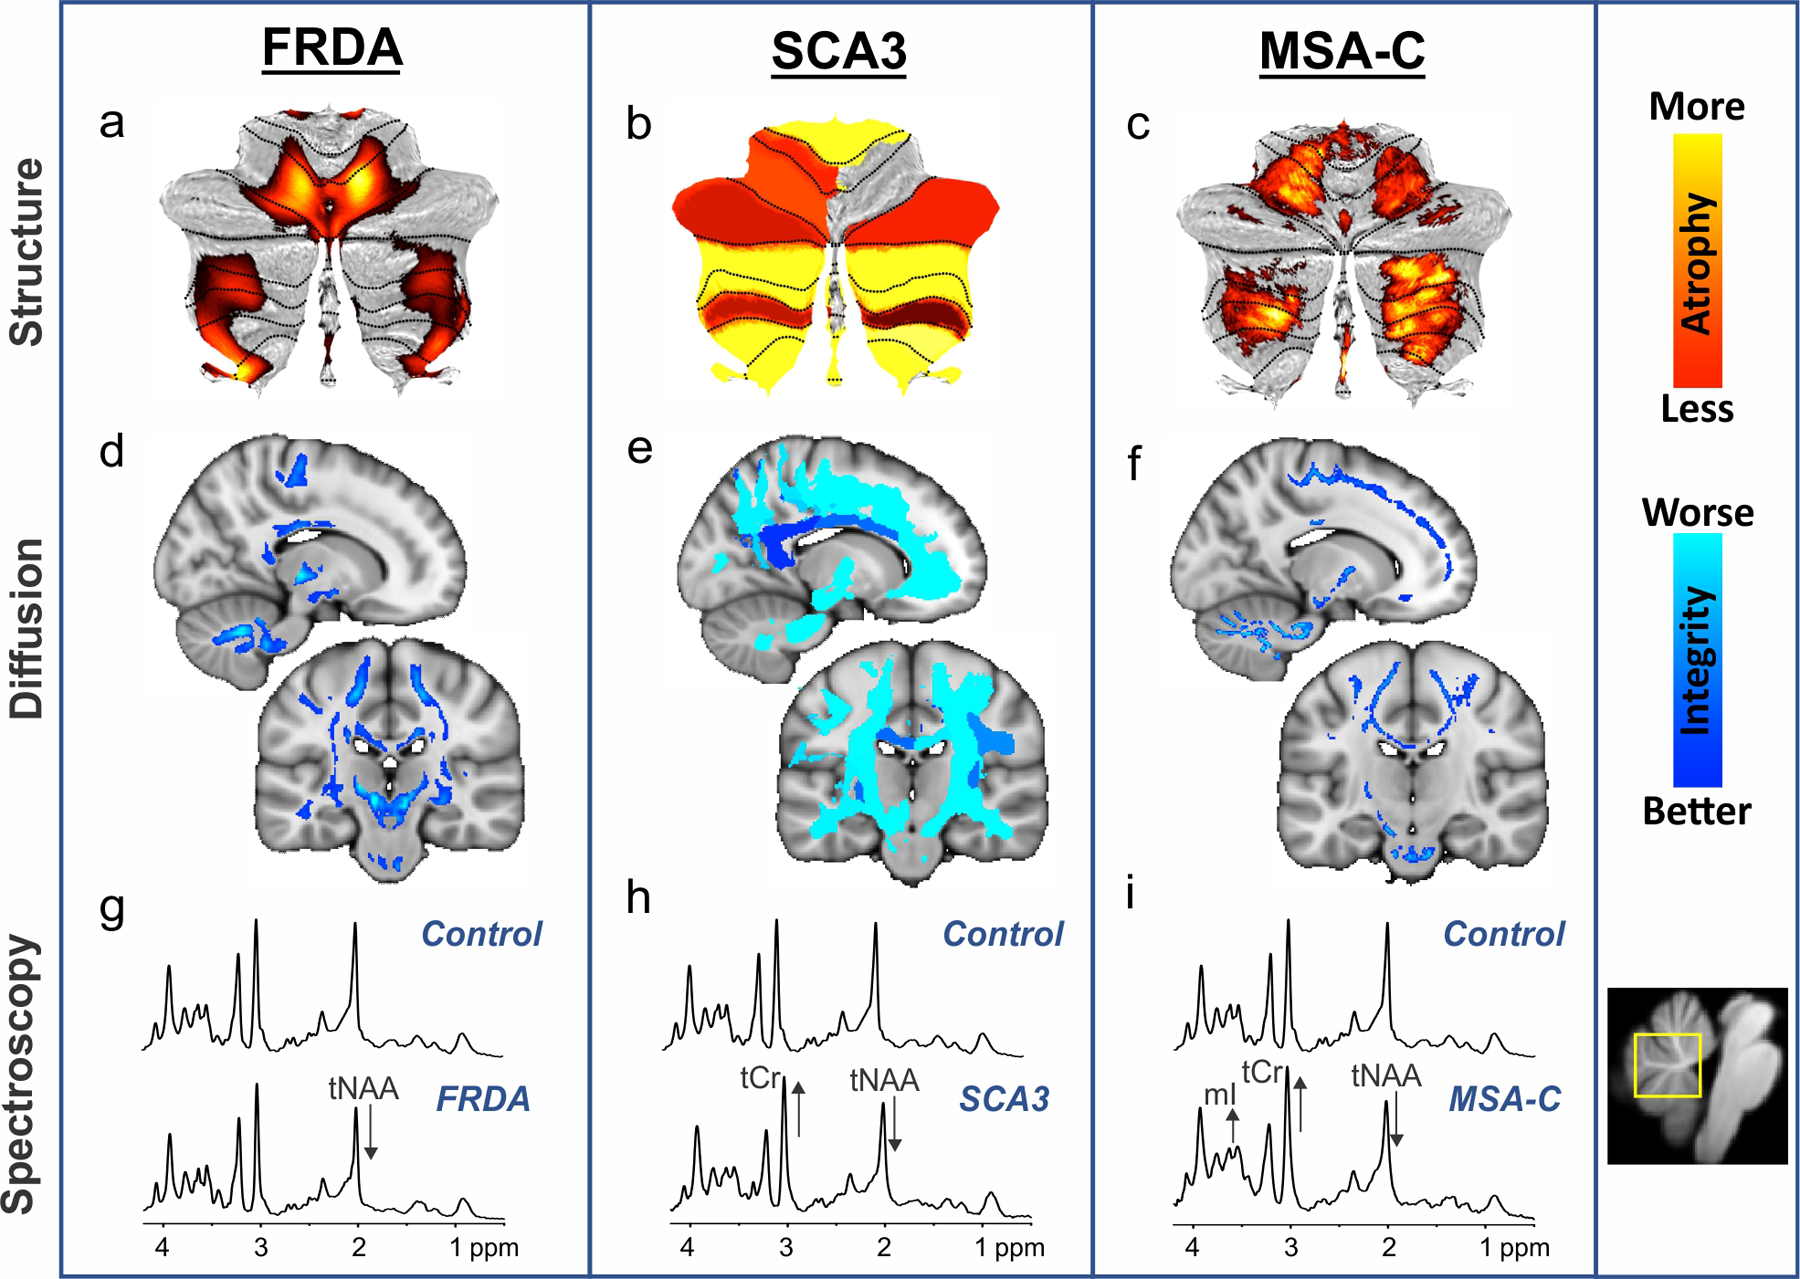
2. Examples of the most common quantitative imaging approaches in the most prevalent degenerative ataxias among autosomal recessive, autosomal dominant and sporadic ataxias, namely Friedreich ataxia (FRDA), spinocerebellar ataxia type 3 (SCA3), and cerebellar multiple system atrophy (MSA-C).

Profiles of cerebellar atrophy from voxel-wise (a, c) and region-of-interest (b) analyses are displayed in hot colors (top). Fractional anisotropy findings from diffusion-weighted imaging, reflecting white matter microstructural integrity, are shown in cool colors (middle) from voxel-wise (d), region-of-interest (e), and tract-based spatial statistics (TBSS) (f) analyses. These images reflect different analysis approaches, but exemplify their common utility in defining key disease characteristics. The bottom panels (g-i) display neurochemical abnormalities in MR spectra obtained at 7T from a vermis voxel (shown in yellow on the right) in individuals with ataxia relative to a control spectrum. The alterations visible in the spectra are marked with arrows. tNAA: total N-acetylaspartate; tCr: total Creatine; mI: myo-Inositol. The panels in this figure are based on data from prior publications [11, 25, 33, 45] or unpublished data.
