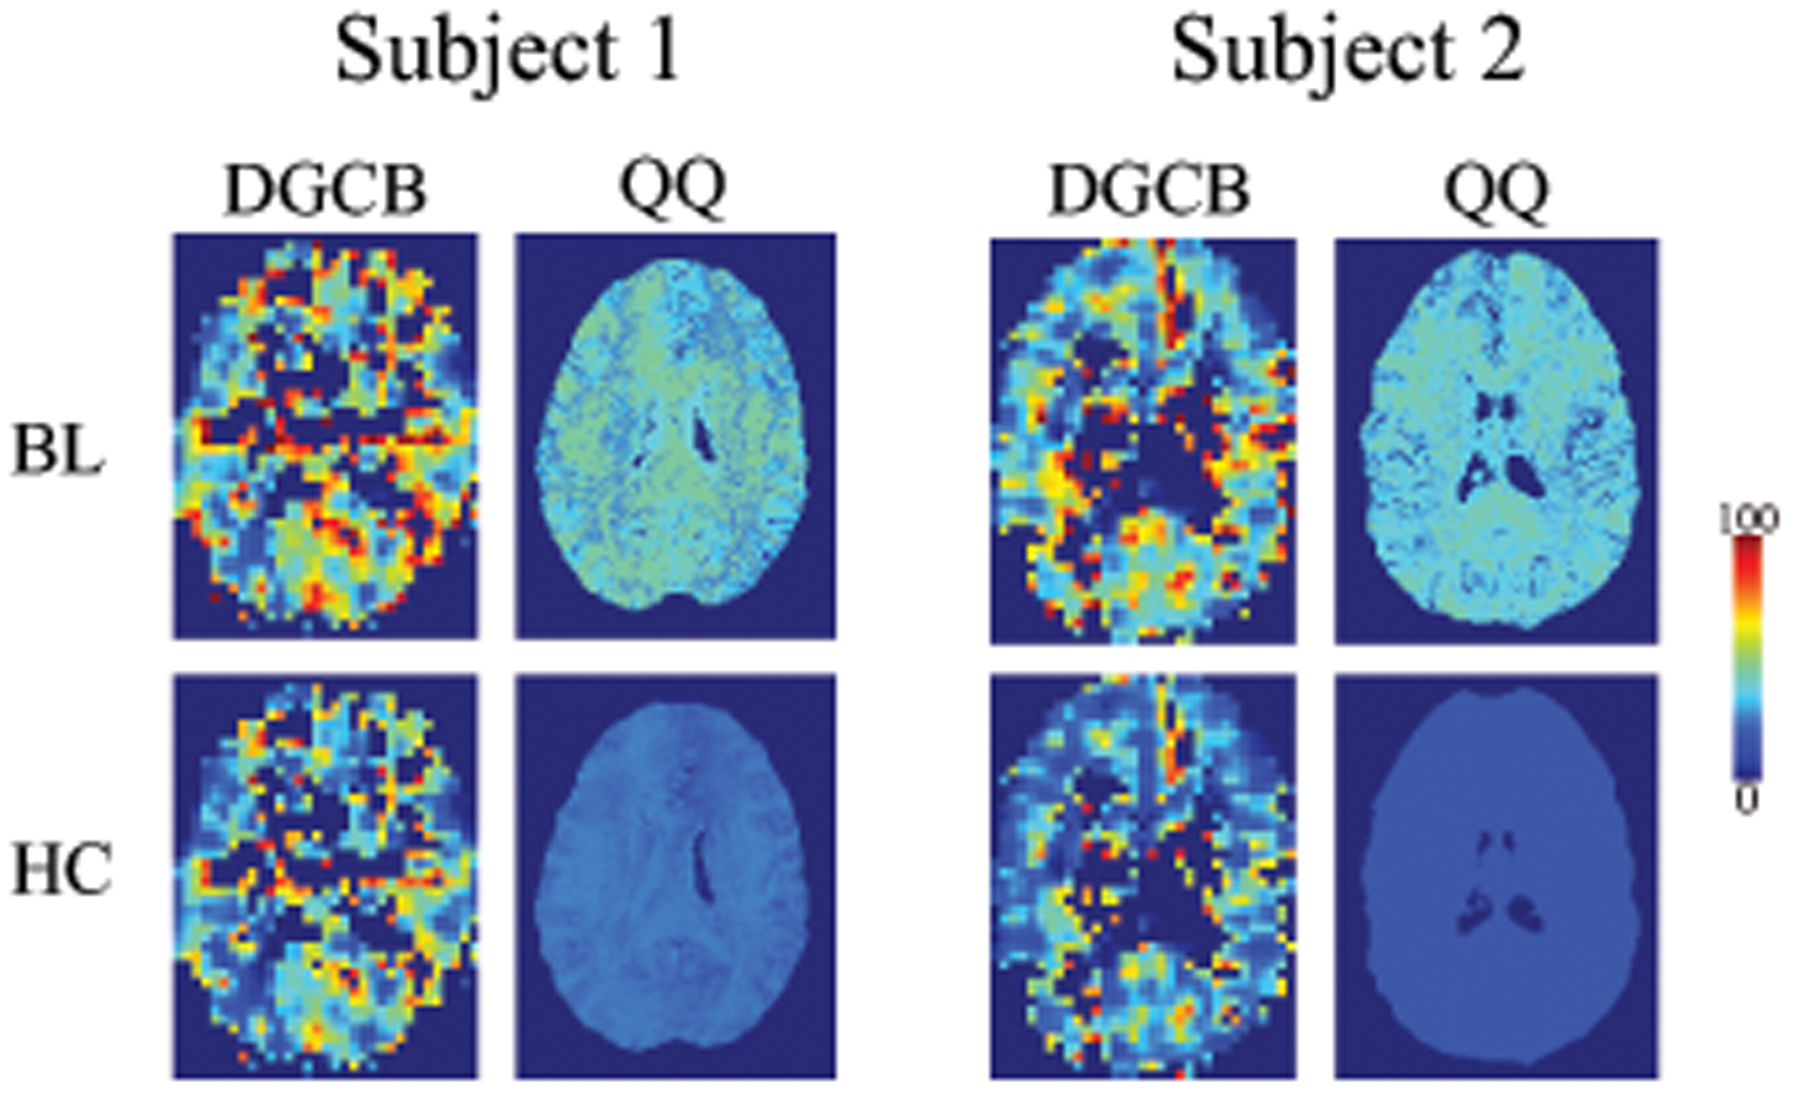
Figure 1.

OEF maps from DGCB and QQ between baseline (BL) and hypercapnia (HC) in two subjects. In DGCB, HC-OEF was estimated based on the iso-CMRO2 assumption with BL-OEF, BL-CBF, and HC-CBF. QQ shows more uniform OEF than DGCB. Both QQ and DGCB shows decreased OEF in HC compared to BL. The unit of color scale is %. Results of all 10 subjects are illustrated in Supporting Information Figures S1 and S2.
