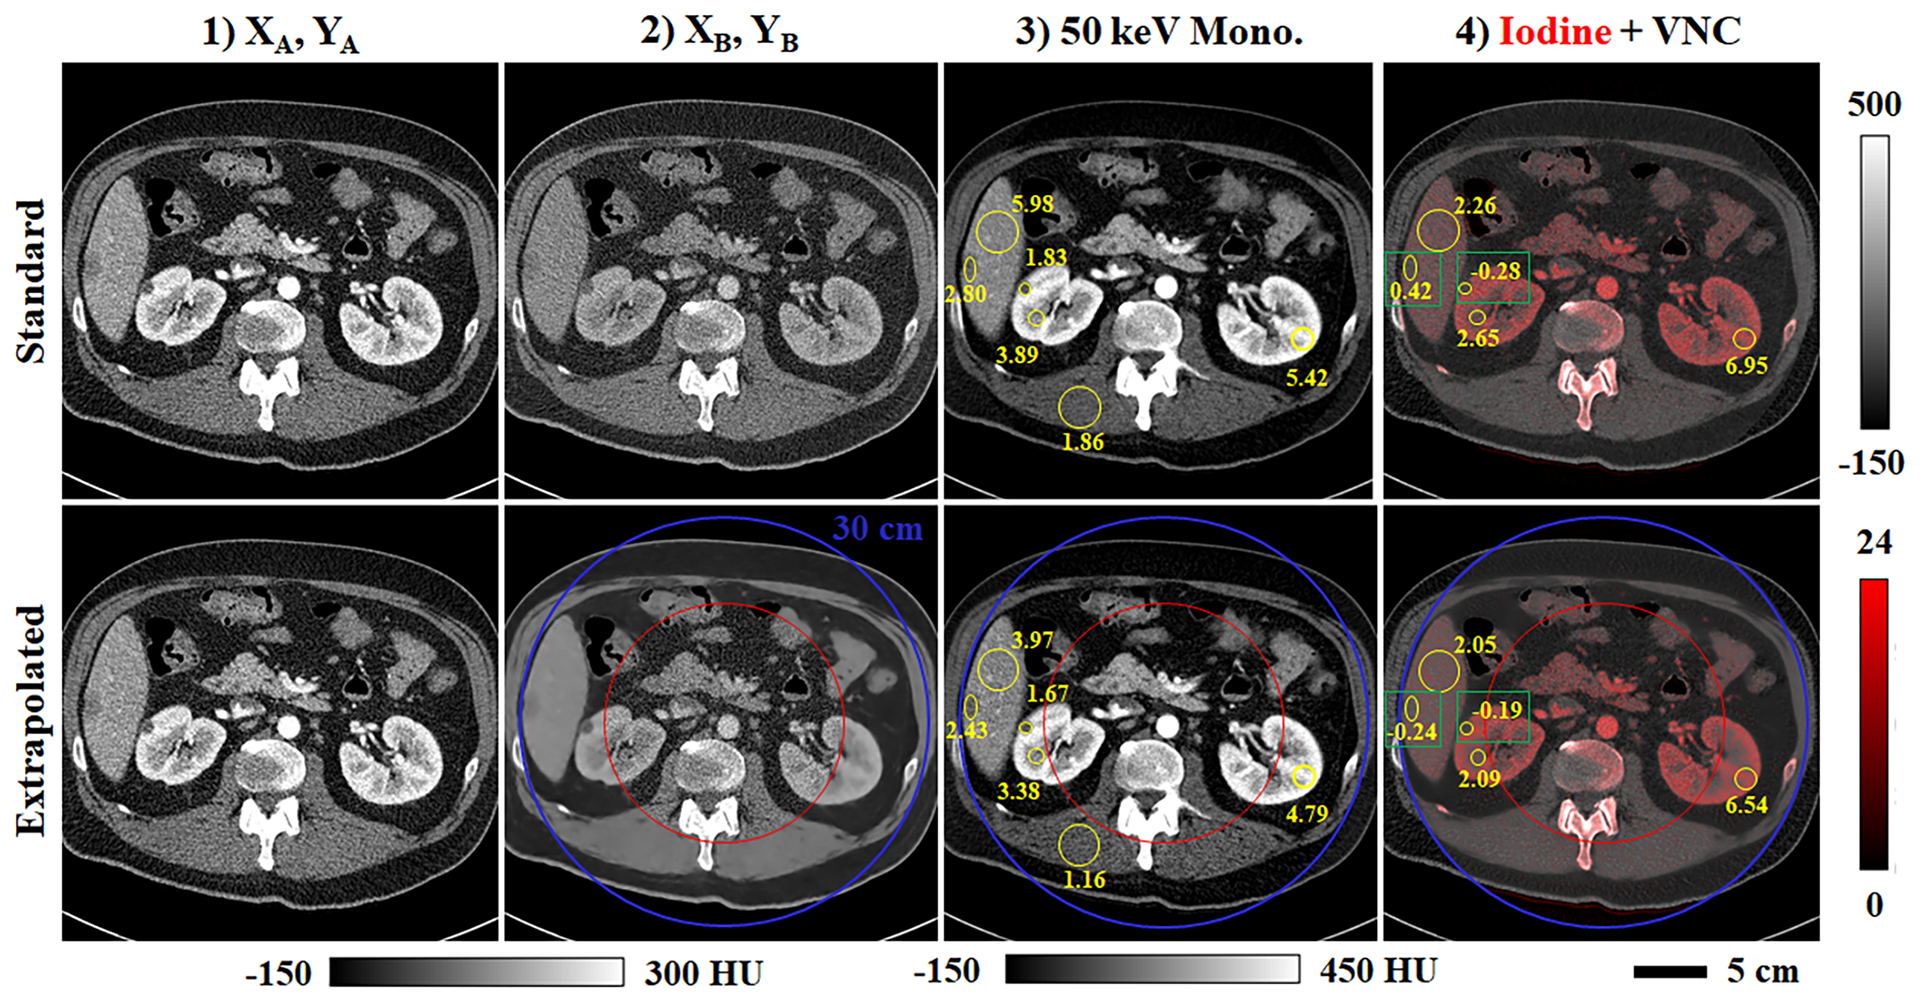
Fig. 11.

Spectral processing of extrapolated data (Test Case 5, Fig. 7). (1) Analytical reconstruction for chain A before (first row) and after (second row) application of the spectral extrapolation network. (2) Analogous data for chain B. (3) 50 keV monoenergetic images including matching ROIs (yellow circles, text) denoting SNR measurements. (4) Iodine decompositions (red color map, mg/mL) overlaid on complementary virtual non-contrast (VNC) images (calibration bars shown at right). Matching regions of interest (yellow circles, text; green boxes) compare mean reference (first row) and extrapolated (second row) iodine concentrations measured in the liver and kidneys.
