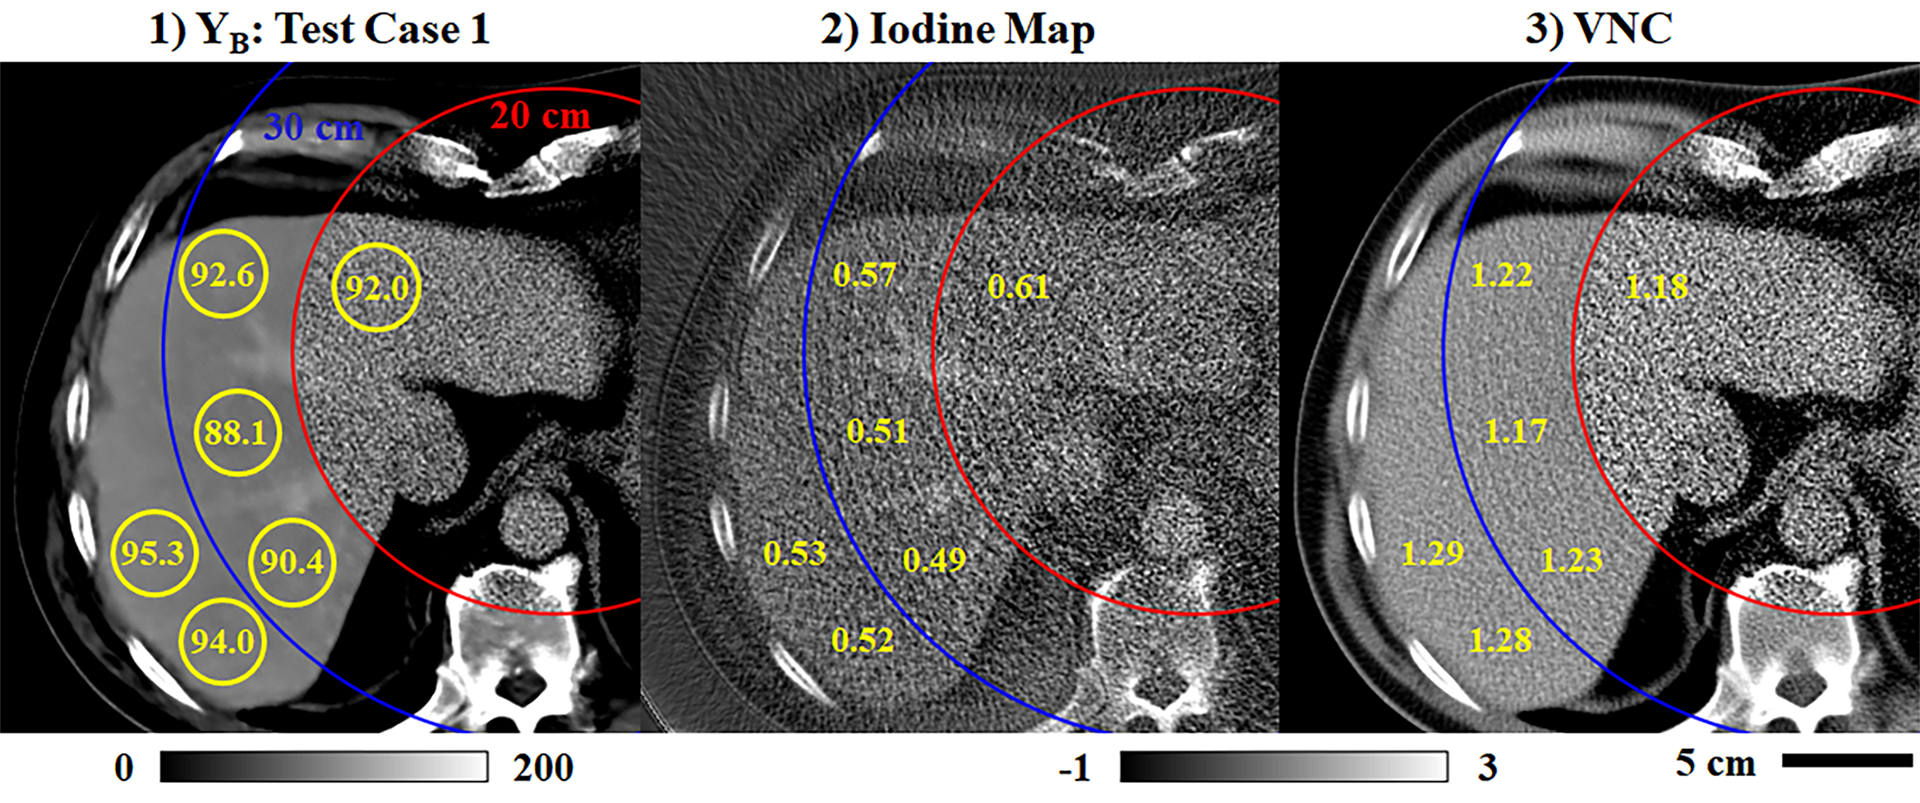
Fig. 12.

Uniformity of spectral measurements (Test Case 1, Fig. 7). (1) Extrapolated chain B data including several ROIs (yellow circles) where mean contrast measurements are reported (yellow text, HU calibration bar). Measurements span the training mask (red circle, 20 cm), the training halo (blue circle, 20–30 cm), and the extended FoV (30+ cm). (2–3) Analogous measurements taken in the iodine map (2) and the VNC image (3), normalized by the contrast measured in the abdominal aorta for each image (calibration bar: −1x to 3x abdominal aorta contrast).
