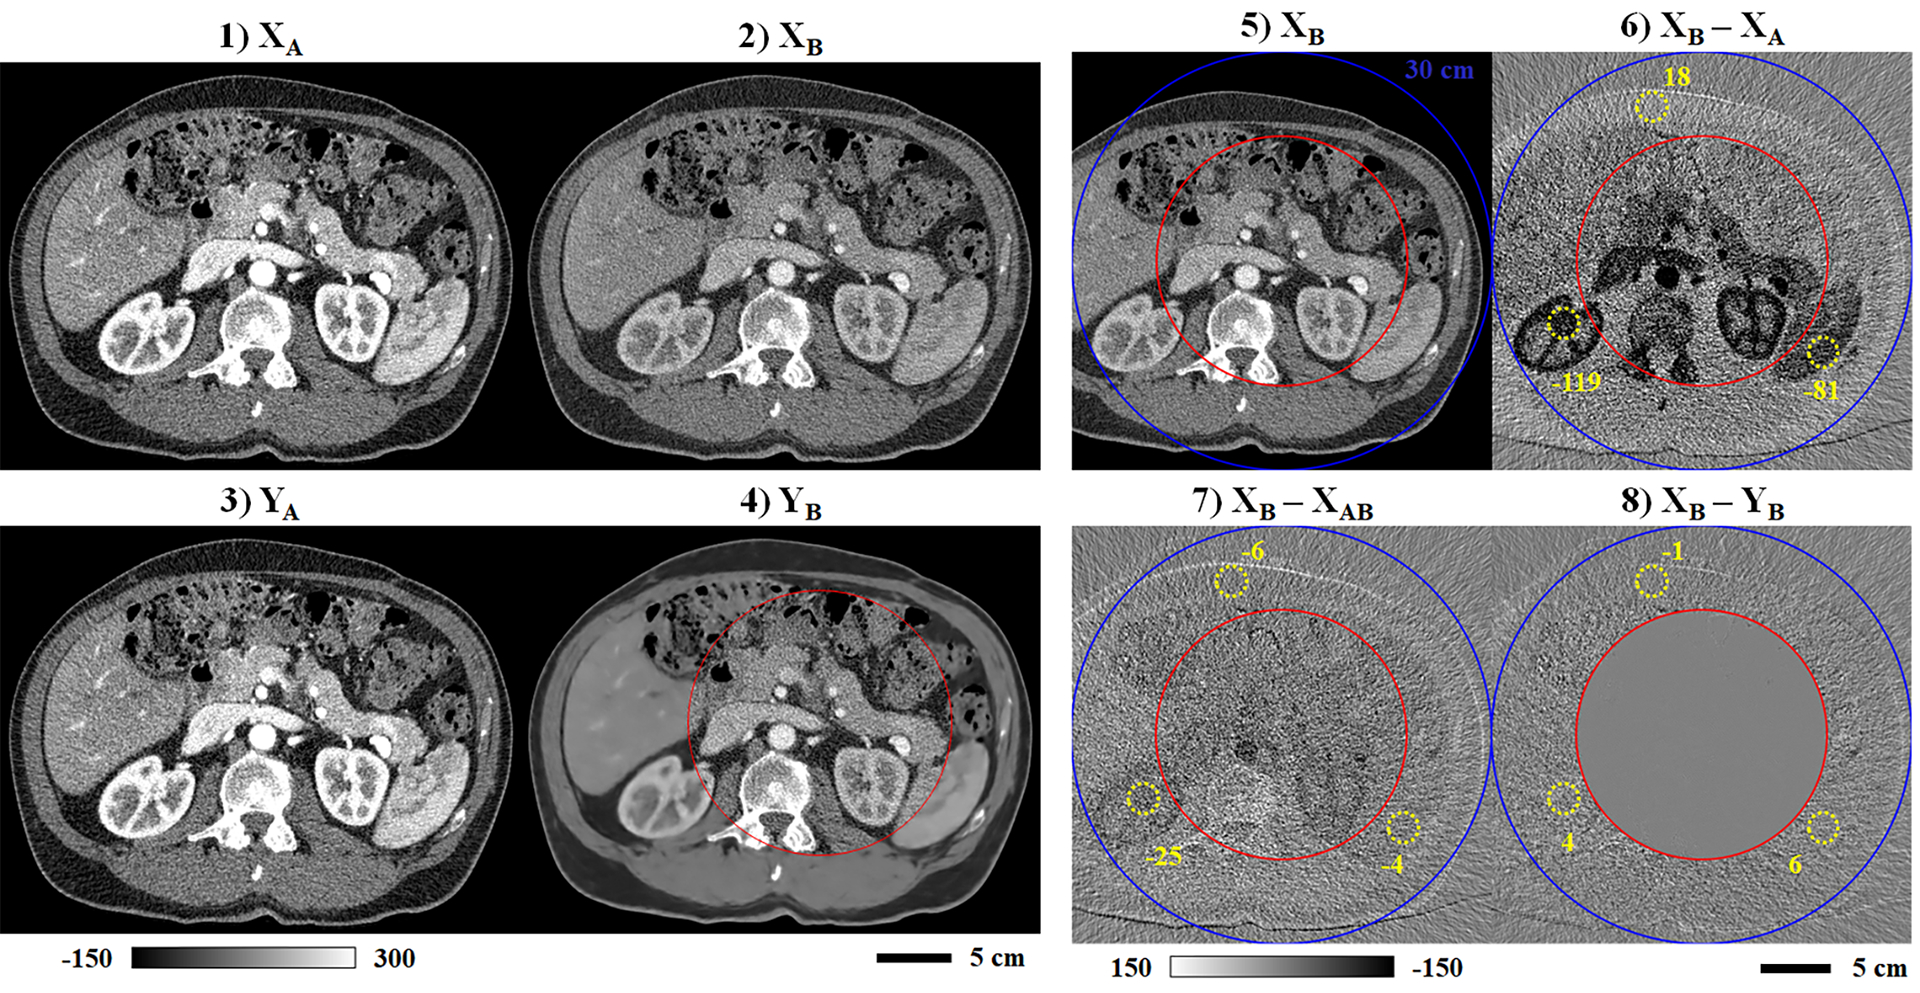
Fig. 5.

Sample network testing results (3 mm slice thickness). Matching network inputs are shown for chain A (1) and chain B (2). Matching network outputs (PLTF and CNN) are also shown for chain A (3) and chain B (4). (5) Repeat of the chain B input (2), including the 30 cm chain B mask (outer mask, blue) and the training mask (inner mask, red). Intensity differences are shown computed between the original chain B reconstruction and the chain A reconstruction (6), the PLTF estimate of the chain B contrast (7), and the final CNN output for chain B (8). Matching, dashed yellow circles denote regions of interest and the average intensity measured inside (HU). Calibration bar units: HU.
