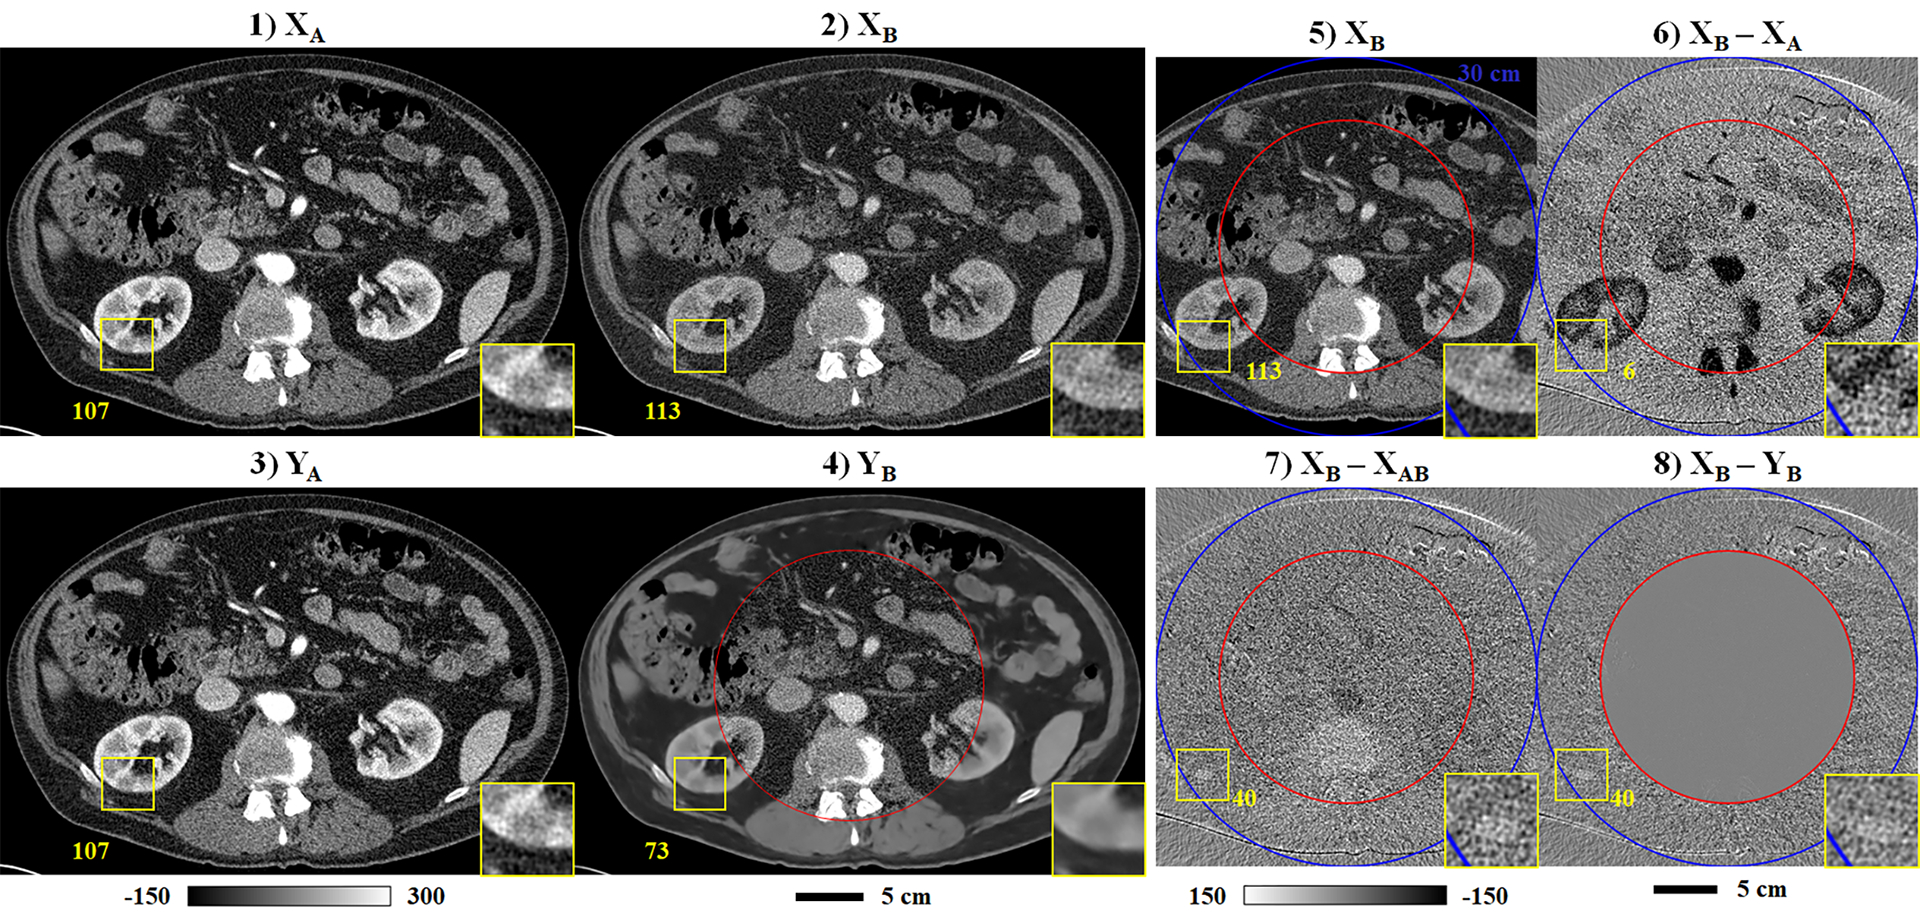
Fig. 6.

Notable error in spectral extrapolation results (validation data). Following the format of Fig. 5, the network inputs (1–2) and outputs (3–4) are shown for chains A and B (3 mm slice thickness). Yellow squares and corresponding insets (240% zoom) denote the location of an apparent cystic lesion of the kidney cortex with a higher HU value measured in the chain B data than in the chain A data (yellow text). This feature is not correctly recovered following spectral extrapolation (4). (5) Repeat of the chain B input (2), including the 30 cm chain B mask (outer mask, blue) and the training mask (inner mask, red). Calibration bar units: HU.
