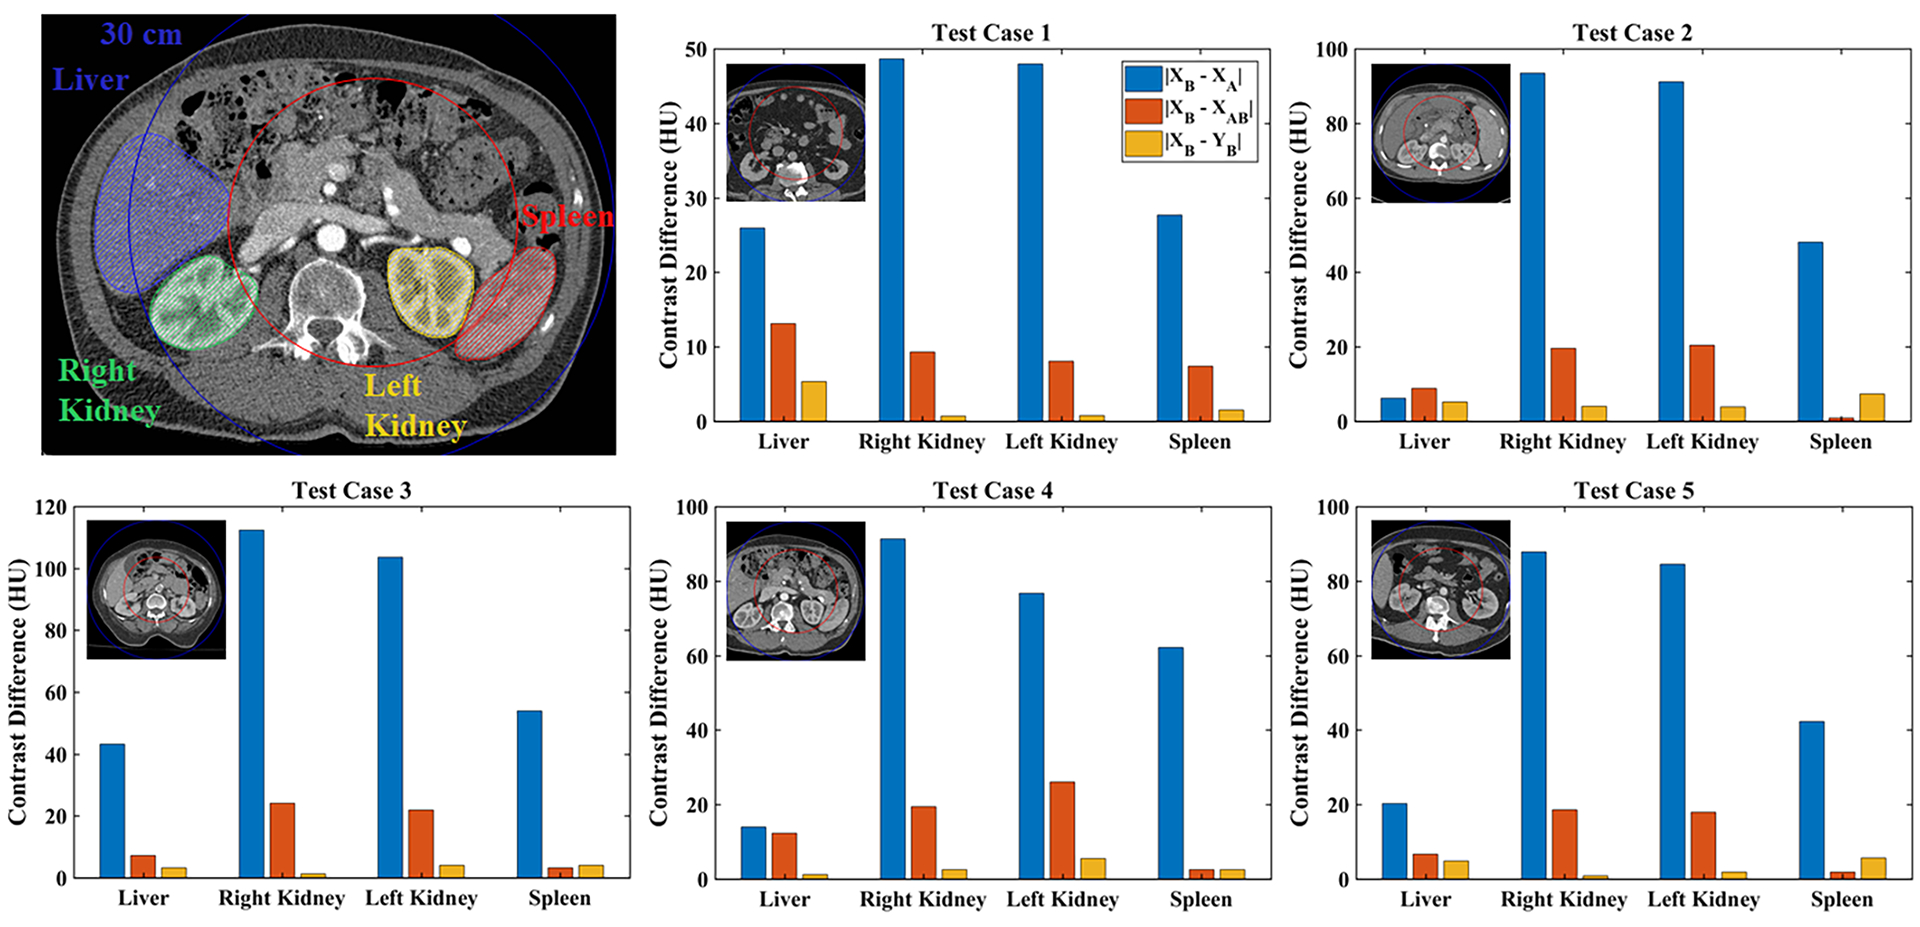
Fig. 7.

Summary of spectral extrapolation results by segmented organ (colored labels) and test data case (1–5). Mean absolute intensity differences measured in the halo between the chain B mask (outer blue circle) and the training mask (inner red circle) are plotted for each stage of the spectral extrapolation process: network inputs (XB – XA), PLTF function output (XB – XAB), CNN output (XB – YB). Results are measured over all 3 mm thick slices containing the target anatomy (no overlap between slices). A small thumbnail image is shown for each test case.
