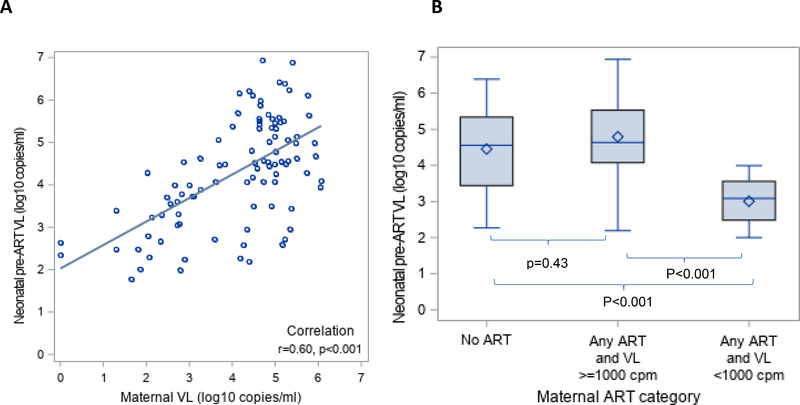
Figure 2: Relationship between maternal viral load (VL) and antiretroviral (ART) category with neonatal pre-ART VL.
(A) Scatterplot of maternal VL (log10 copies/ml) and neonatal pre-ART VL (log10 copies/ml). (B) Box and whisker plot of neonatal pre-ART VL by maternal ART/VL category (No ART, any ART and VL ≥1000 copies/ml, any ART and VL <1000 copies/ml).

