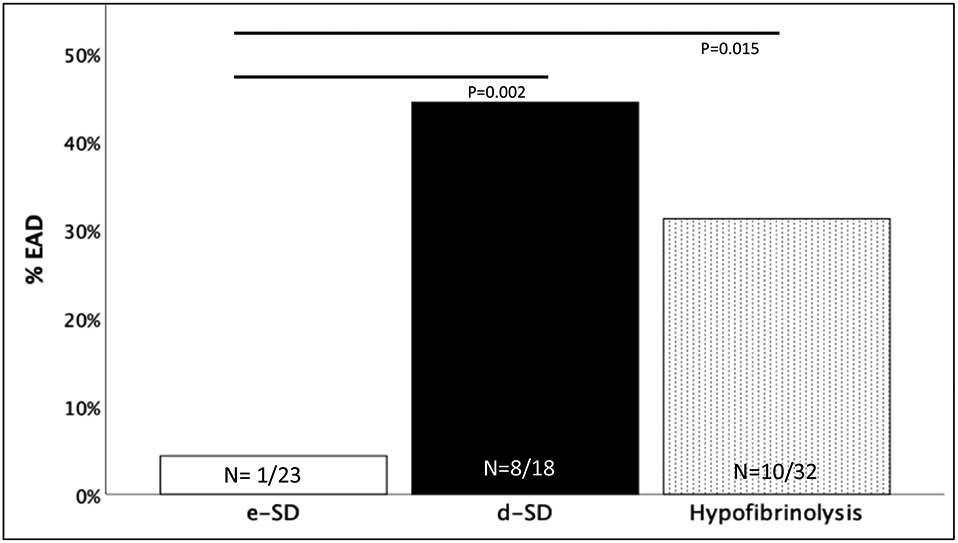
Figure 3: Rates of Early Allograft Dysfunction Between Recipient Cohorts.

e-SD = Early Shutdown, d-SD= Delayed Shutdown, EAD= Early Allograft Dysfunction, P Values represent Fisher’s Exact test between e-SD and d-SD or Hypofibrinolysis.
Y-axis represents the percent of patients with EAD within the three cohorts along the x-axis
