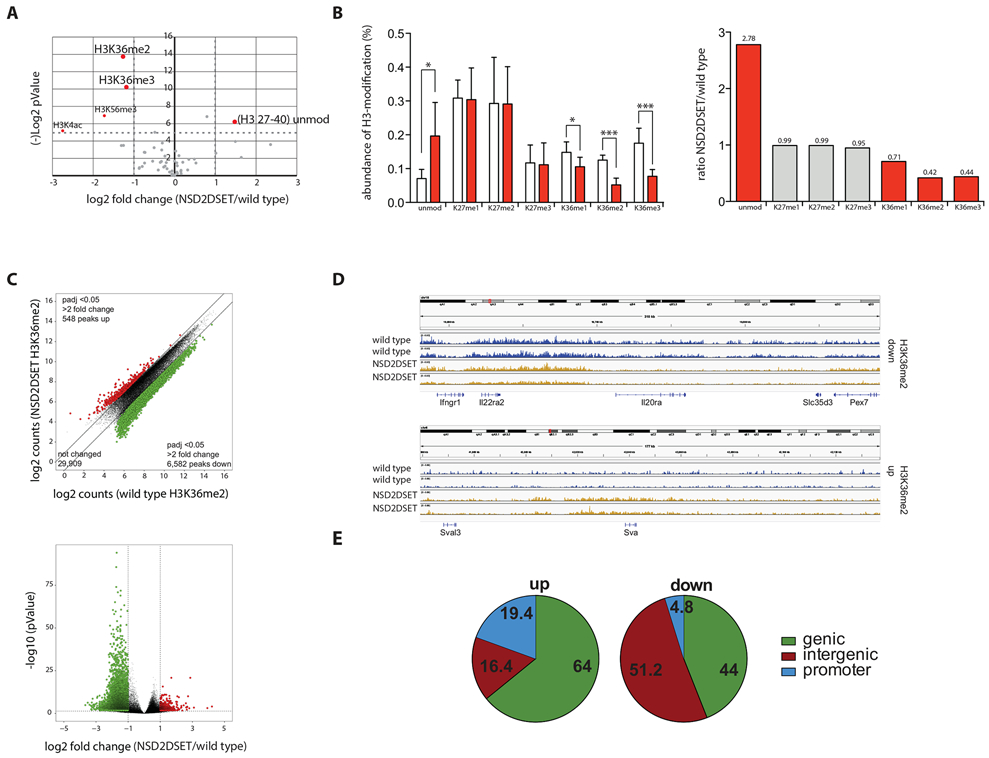
Fig. 2: Selective methylation of histone H3 at Lys36 by NSD2.

A) Volcano plot shows changes in relative abundance of distinct modifications of histones extracted from splenic B cells purified from Nsd2loxSET/loxSET (wild type) or Mb1creNsd2loxSET/loxSET (NSD2ΔSET) mice. Values over 4.32 in the Y-axis [(−)log2 pValue] corresponding to −log2 (0.05) are significant and highlighted in red. The data represent 2 biological replicates and 3 independent measurements. Significance was determined by unpaired Student’s T-test. B) The fraction of histone H3 modified at Lys36 was determined by combining the frequencies for all histone H3 peptides carrying this modification, independent of other modifications present on the same peptide. Peptides of controls (from splenic B cells isolated from Nsd2loxSET/loxSET mice) are represented by white bars, peptides from splenic B cells isolated from Mb1creNsd2loxSET/loxSET mice are in red (left graph). The significant changes in abundance of H3-peptides carrying the indicated modifications are depicted in red bars, not significant changes in grey bars. Numbers above the bars indicate the fold change of Mb1creNsd2loxSET/loxSET (NSD2ΔSET) over Nsd2loxSET/loxSET (wild type) (right graph). The data represent 2 biological replicates and 3 independent measurements. C) Scatter plot of H3K36me2 peaks of splenic B cells Nsd2loxSET/loxSET (wild type) and Mb1creNsd2loxSET/loxSET (NSD2ΔSET) mice. Significant increase (red) or decrease (green) in specific peaks are indicated (top). Volcano plot illustrating differential H3K36me2 levels in splenic B cells from Nsd2loxSET/loxSET (wild type) and Mb1creNsd2loxSET/loxSET (NSD2ΔSET) mice (bottom). Significant increase (red) or decrease (green) in specific peaks are indicated. Data plotted are average normalized H3K36me2 values of called peaks from 3 biological replicates. D) Sample IGV tracks of H3K36me2 confirming the locus specific changes in Nsd2loxSET/loxSET (wild type) vs. Mb1creNsd2loxSET/loxSET (NSD2ΔSET) splenic B cells. Data represents 2 biological replicates and 3 independent measurements. E) The gain (left) and loss (right) of H3K36me2 in Mb1creNsd2loxSET/loxSET vs. Nsd2loxSET/loxSET splenic B cells in genic, intergenic, and promoter regions. The data represent 2 biological replicates and 3 independent measurements.
