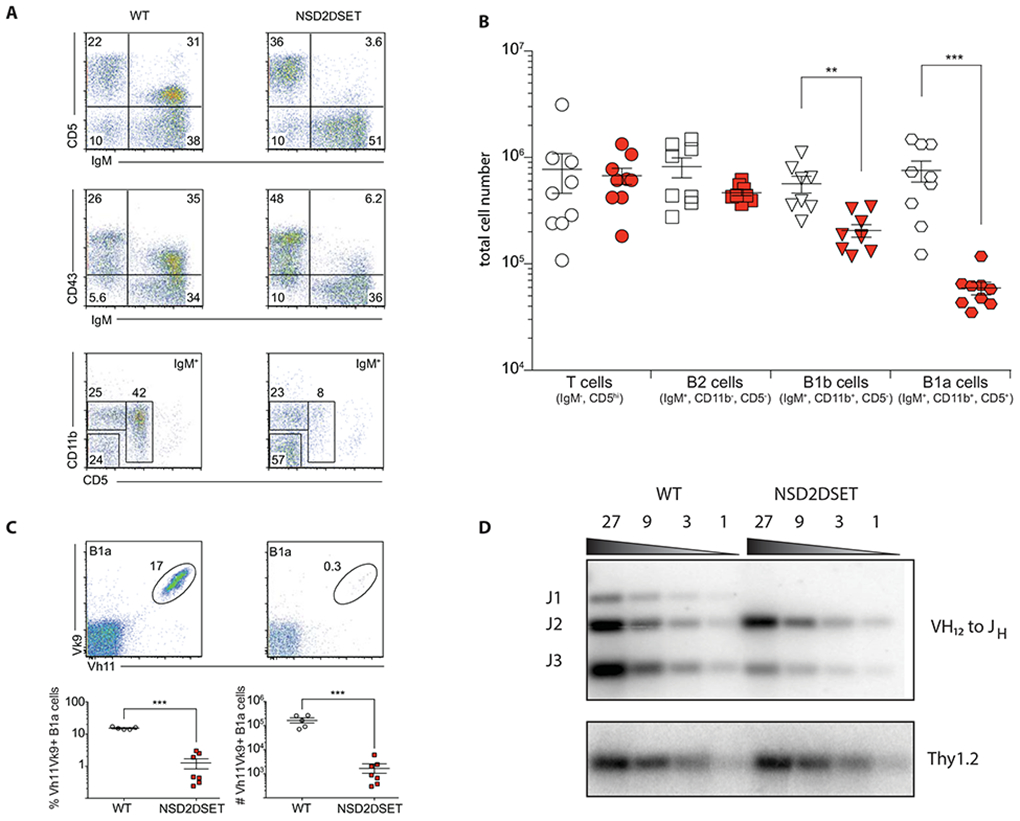
Fig. 5: NSD2 is essential for B1 cell generation.

A) FACS plots show relative abundance of T cells (CD5+IgM−), B1a (IgMhiCD11b+CD5+), and B1b (IgMhiCD11b+ CD5−), and B2 (IgM+CD11b−CD5−) cells in the peritoneal cavity. The gating for the top and the middle plots in on live cells, for the bottom plots on live and IgM+ cells. Representative plots of more than 3 independent experiments with 3 or more mice per group are shown. B) Absolute numbers of distinct lymphoid cells in the peritoneal cavity. Open symbols (Nsd2loxSET/loxSET) and red symbols (Mb1creNsd2loxSET/loxSET) mice. Each symbol represents one mouse (9 mice per genotype in 3 independent experiments). C) The frequency (bottom left) and absolute number (bottom right) of peritoneal cavity B1a cells (gated on live/IgMhi and CD5+) expressing phosphatidylcholine specific B cells receptor (Vκ9 Vh11) in Nsd2loxSET/loxSET (WT, open symbols) and Mb1creNsd2loxSET/loxSET (red symbols) are shown. Representative plots of 2 independent experiments with six mice in total are depicted. Significance was determined by unpaired t-test *p ≤ 0.05; **p ≤ 0.01; ***p ≤ 0.001. D) Southern blotting analysis of Vh12 to Jh rearrangements in splenic B cells isolated from Nsd2loxSET/loxSET (WT) and Mb1creNsd2loxSET/loxSET (NSD2ΔSET) mice. Thy1.2 was probed as loading control. A representative experiment out of 2 performed is shown (no technical replicates).
