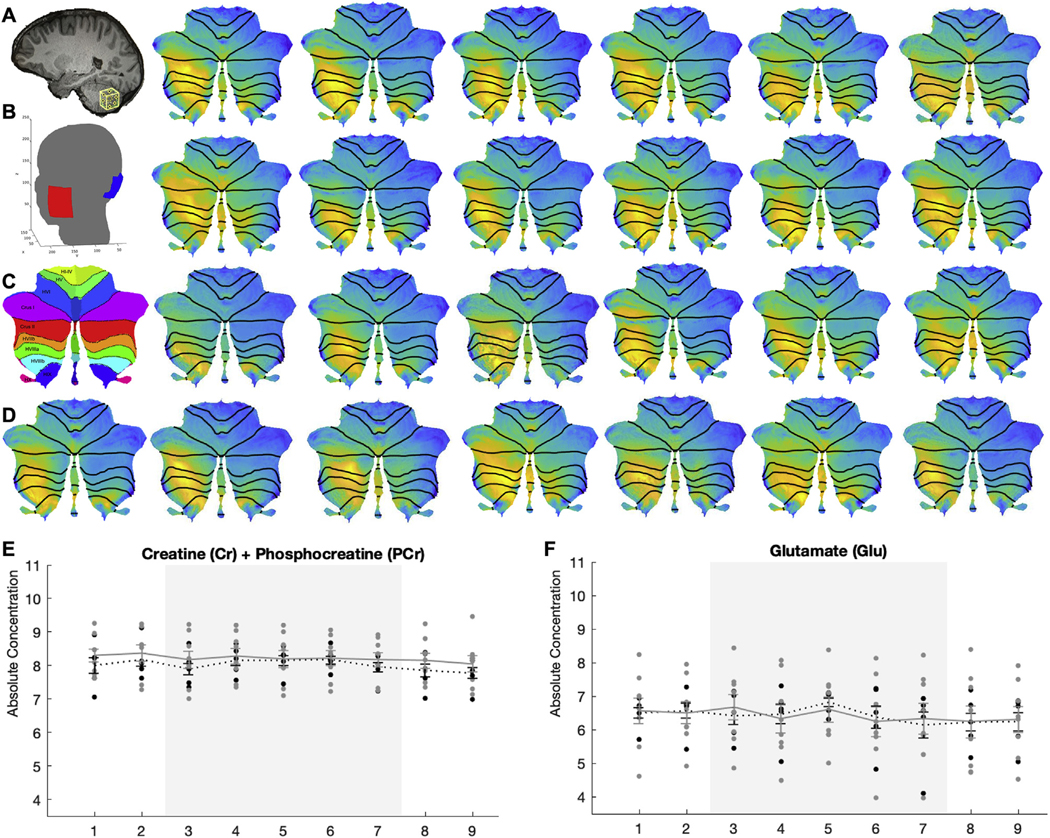
Fig. 1.

(A) Sagittal view of brain with spectroscopy voxel positioned in the cerebellum. (B) Electrode montage used for ROAST indicating scalp placement of electrodes. (C) Diagram of cerebellar lobules in flatmap (cf. Diedrichsen & Zotow, 2015, PLoS One). (D) Individual cerebellar flatmaps displaying standardized electric field magnitudes. (E) Absolute concentrations of cerebellar total Creatine and (F) Glutamate in active (black dots) and sham (grey dots) stimulation groups across each 4-min spectroscopy acquisition block (x-axis). Grey shading indicates the period of active stimulation administration.
