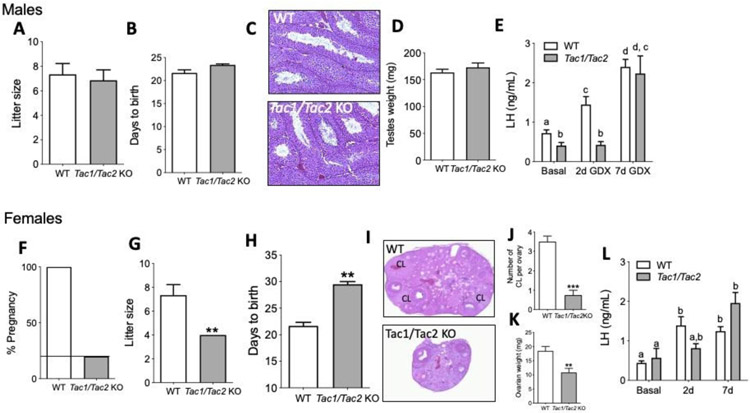
Figure 2: Fecundity test, gonadal histology and response to gonadectomy in male and female Tac1/Tac2KO mice.
Litter size (A), parturition latency (B), testicular histology (C) and testicular weights (D) in WT and Tac1/Tac2KO males (n = 7/group). Circulating LH levels before (basal) and 2 and 7 days after castration (E) (n = 10/group). In females, percentage of fertile females during 11 weeks of mating (F), litter size (G), parturition latency (H), ovarian histology (I), number of corpora lutea (CL) (J) and ovarian weights (K) in WT vs Tac1/Tac2KO females (n = 10/group). Circulating LH levels before (basal) and 2 and 7 days after ovariectomy (L). p<0.05, **p<0.01, *** p<0.001 Student t test. Different letters indicate significantly different values after a Two-Way ANOVA and repeated measures Fisher’s post hoc test.

