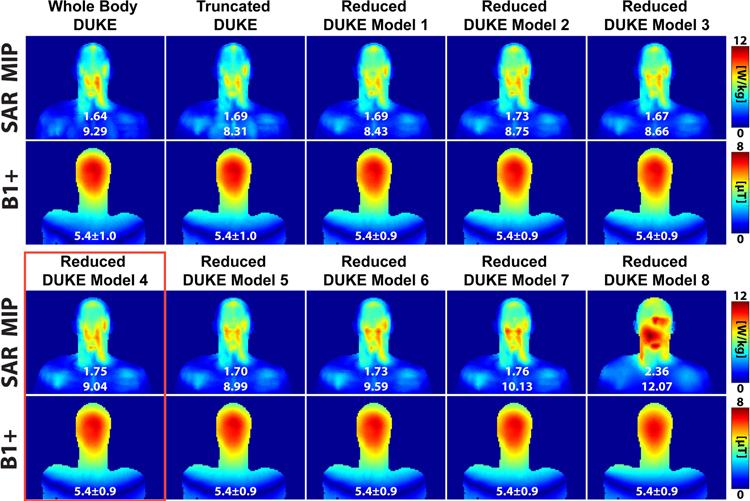
Figure 6:
SAR (maximum intensity projection) and B1+ maps (center coronal slice) for the different Duke body models simulated in this work. The numbers in white below the SAR maps are the global and 10g local SAR, respectively. The numbers below the B1+ maps are the mean and standard deviation in μT. Excluding Reduced Duke Model 8, the SAR distributions are similar among the different Duke simplifications and differ mainly in the amplitude of the SAR hotspot. Reduced Duke Model 4 is highlighted in red because it corresponds to the tissue grouping used in the volunteers.

