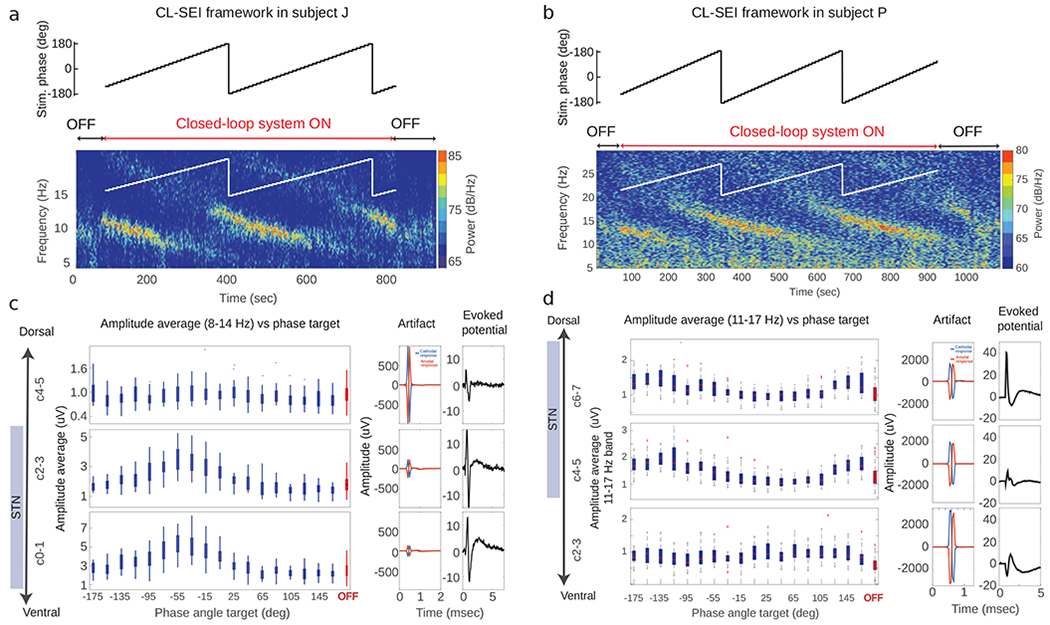
Figure 2.

Amplitude of oscillations as a function of stimulation phase. (a, b) Results of experiments in which CL-SEI was tested in animal J and P. The targeted (reference) phase angle for stimulation was varied by 10 degrees every 10 seconds, while the stimulation current delivered to the GPi was fixed at 600 μA in both animals. Spectrograms illustrating the power over time and frequencies for different phase angles in the OFF and ON stimulation state are shown in (a) and (b) for animal J and P, respectively. The spectrograms show data recorded using electrode pairs used to implement the closed-loop stimulation algorithm. The amplitude of neural oscillations as a function of the targeted phase angle and across electrode pairs is shown for animal J and P in (c) and (d), respectively. Electrodes C1-C3 in animal J and C4-C6 in animal P used for sensing are located within the STN. The artifacts and evoked potentials computed across electrode pairs are shown in (c) and (d) (center and right columns). Evoked potentials were calculated based on stimulation-triggered averages of LFPs by using both cathodal and anodal stimulation (Xa(t) and Xc(t)). These evoked potentials were calculated as ((Xa(t) + Xc(t))/2).
