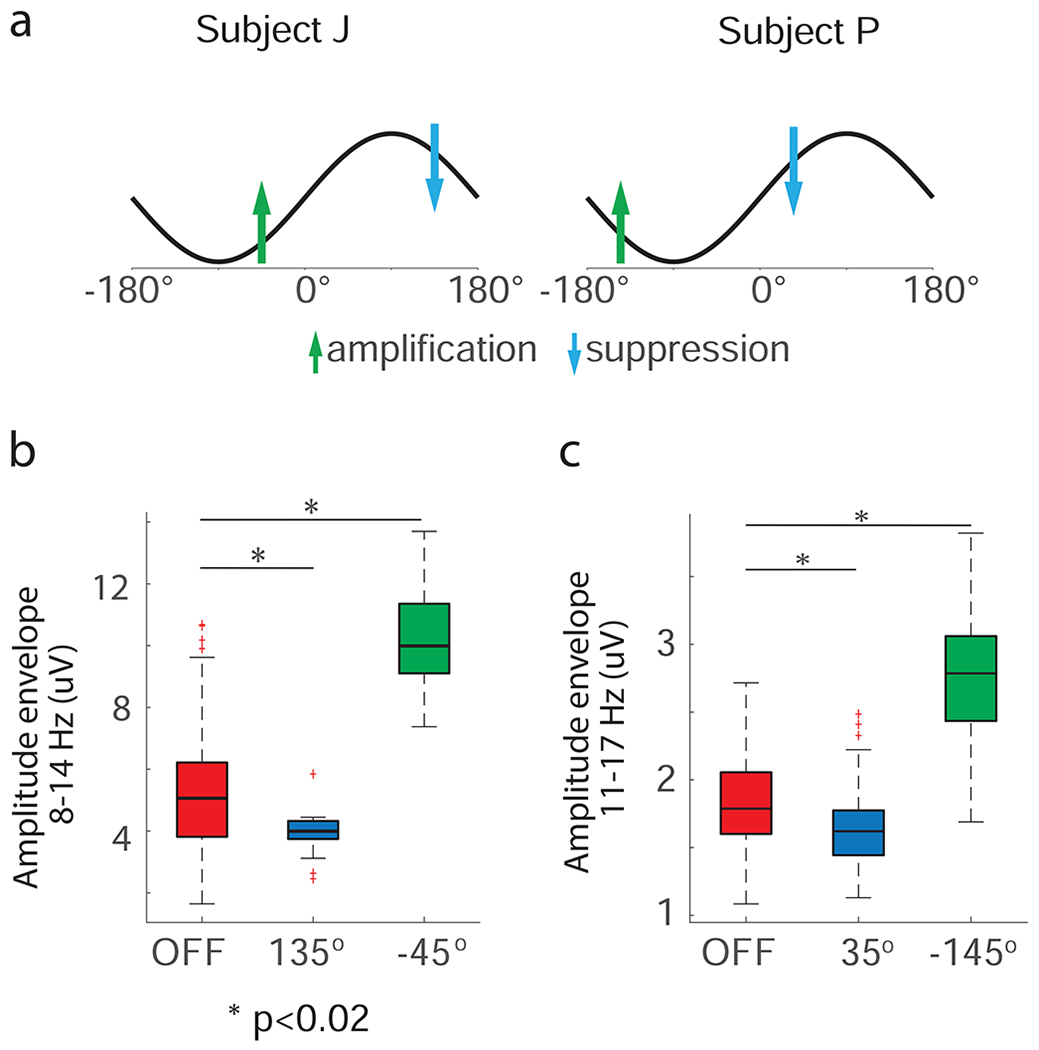
Figure 3.

Differences between the amplitude of oscillations when stimulation was OFF and when stimulation was delivered at the phase angles associated with maximum suppression/amplification. (a) Schematic of phase angles at which stimulation was delivered to achieve maximum suppression (blue arrow) or amplification (green arrow) of neural oscillations in the 8-14 Hz band for animal J and 11-17 Hz band for animal P, respectively. (b) Box plots illustrating the interquartile ranges and medians of 1-second segments of the amplitude envelope of LFP data filtered in the targeted frequency band in the OFF stimulation state and when stimulation was delivered at phase angles that achieved maximum suppression and amplification of oscillations. We assumed that the difference between measurements in the two conditions was significant when p < 0.05. The p-values resulting from this test were corrected for the number of comparisons via the Bonferroni method. The number of data segments (n) the in the OFF stimulation, amplification, and suppression conditions for animal J were 143, 27, and 18, respectively; for animal P these numbers were 150, 20, and 20, respectively. The boxplots were created based on data from the experiment illustrated in Fig. 2.
