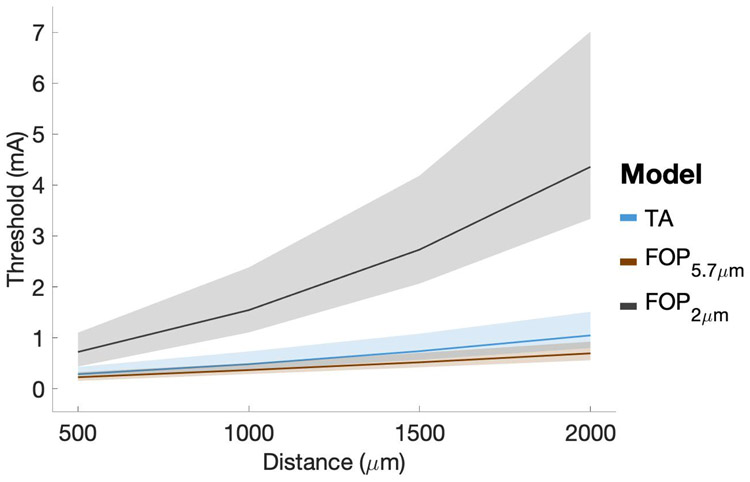
Figure 8.
Current-Distance relationships. Cathodic DBS with 60 μs stimuli. The black line represents FOPs with a 2 μm diameter, while the orange line represents FOPs with a 5.7 μm diameter. The blue line represents TA models with a branch degree = 3. Median values are plotted and shaded regions represent the interquartile range.

