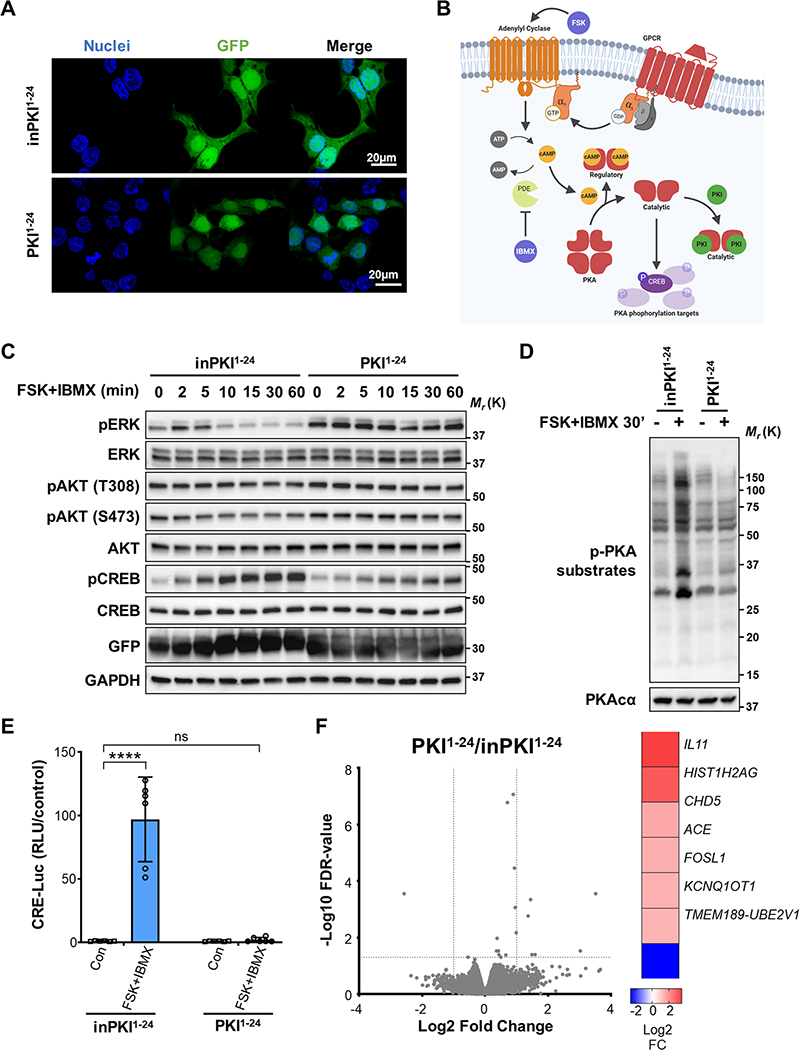
Figure 1: PKI potentiates the activation of ERK downstream of cAMP.
A. Immunofluorescence (IF) image showing cellular localization of GFP-tagged PKI1−24 peptides (green). Cell nuclei are stained with Hoescht 33342 (blue). B. Illustration showing PKA signaling mediated by cAMP and inhibited by PKI after stimulation with FSK, an adenylyl cyclase (AC) activator, and IBMX, a phosphodiesterase (PDE) inhibitor. C. Western blot time course of the phosphorylated target proteins in cells transduced with control inPKI1−24 or active PKI1–24. Cells were stimulated with FSK and IBMX for the times indicated. D. Western blot image of PKA-phosphorylated substrates following FSK and IBMX stimulation for 30 min in cells transduced with inPKI1−24 or PKI1–24. E. CRE-Luc reporter assay showing PKA activation of CREB with (+) or without (−) FSK and IBMX stimulation for 6 hrs in cells transduced with control inPKI1−24 or active PKI1–24. Results shown are normalized means ± SD, N = 6, and analyzed with two-way ANOVA with Sidak’s post-hoc multiple comparisons test. F. RNA-seq analysis of gene expression differences in HEK293 cells transfected with PKI1−24 compared with cells expressing inPKI1−24; N = 3. Volcano plot shows gene expression changes expressed as Log2 fold change and -Log10 of false discovery rate (FDR)-corrected p values, dotted lines indicate fold change 2 and a p value of 0.05 in the x and y axes respectively. Significantly differentially expressed genes following PKI1−24 expression are indicated in the heat map (right) with their corresponding Log2 fold change. For all panels: ****, p<0.0001; ns, not-significant p>0.05.

