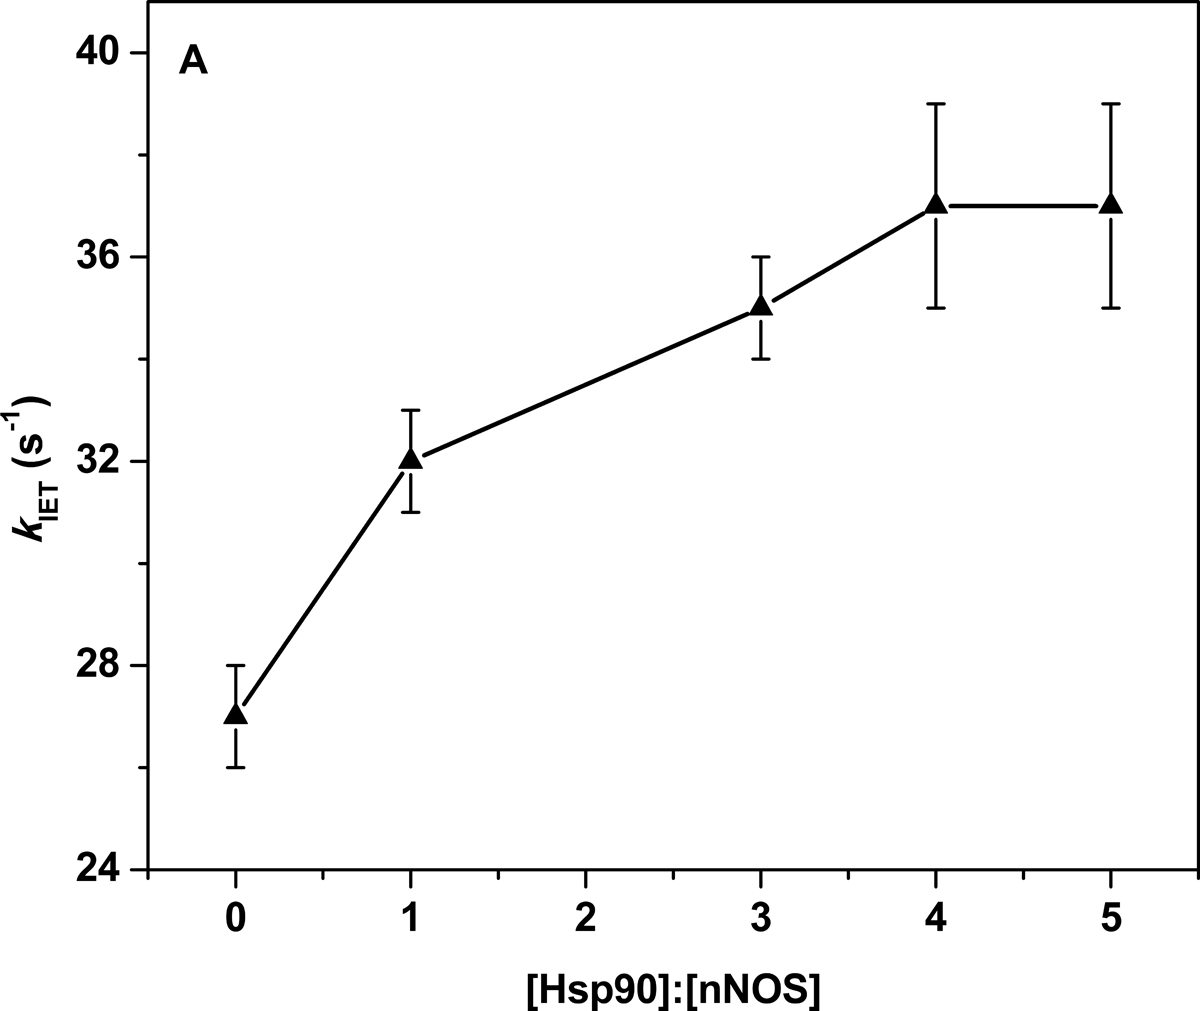
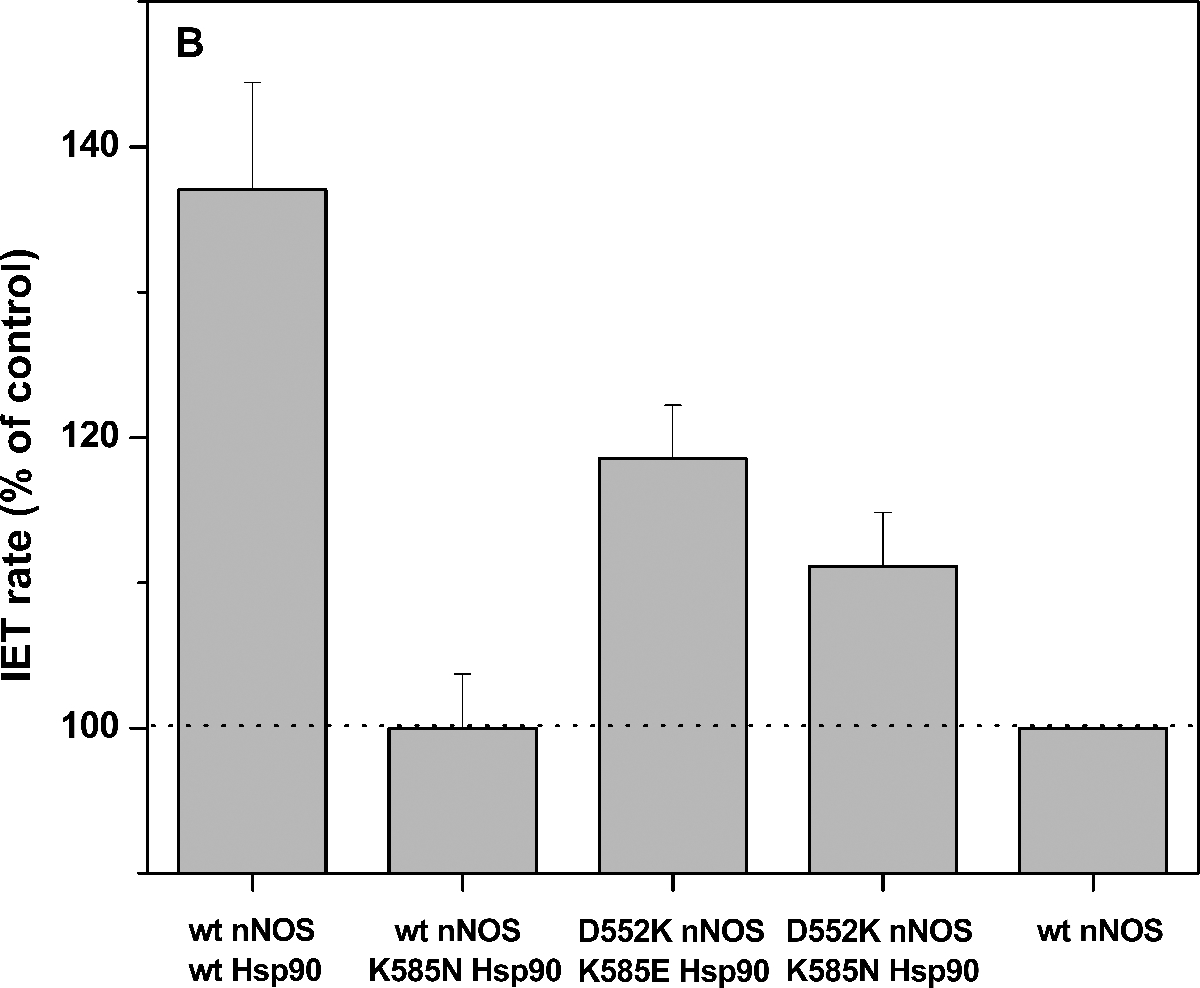
Figure 3.


(A) Plot of the FMN–heme IET rates of wt rat nNOS protein with added wt human Hsp90α protein. The enhancement effect saturates at [Hsp90]:[nNOS] ≥ 4:1. (B) Comparison of the FMN–heme IET rates (% of control) of wt or mutant nNOS with added wt or mutant Hsp90α protein ([Hsp90]:[nNOS] = 4:1); dotted line indicates the control, i.e., the CaM-bound wt nNOS only sample. Bars indicate means ± S.D.
