
Figure 7.
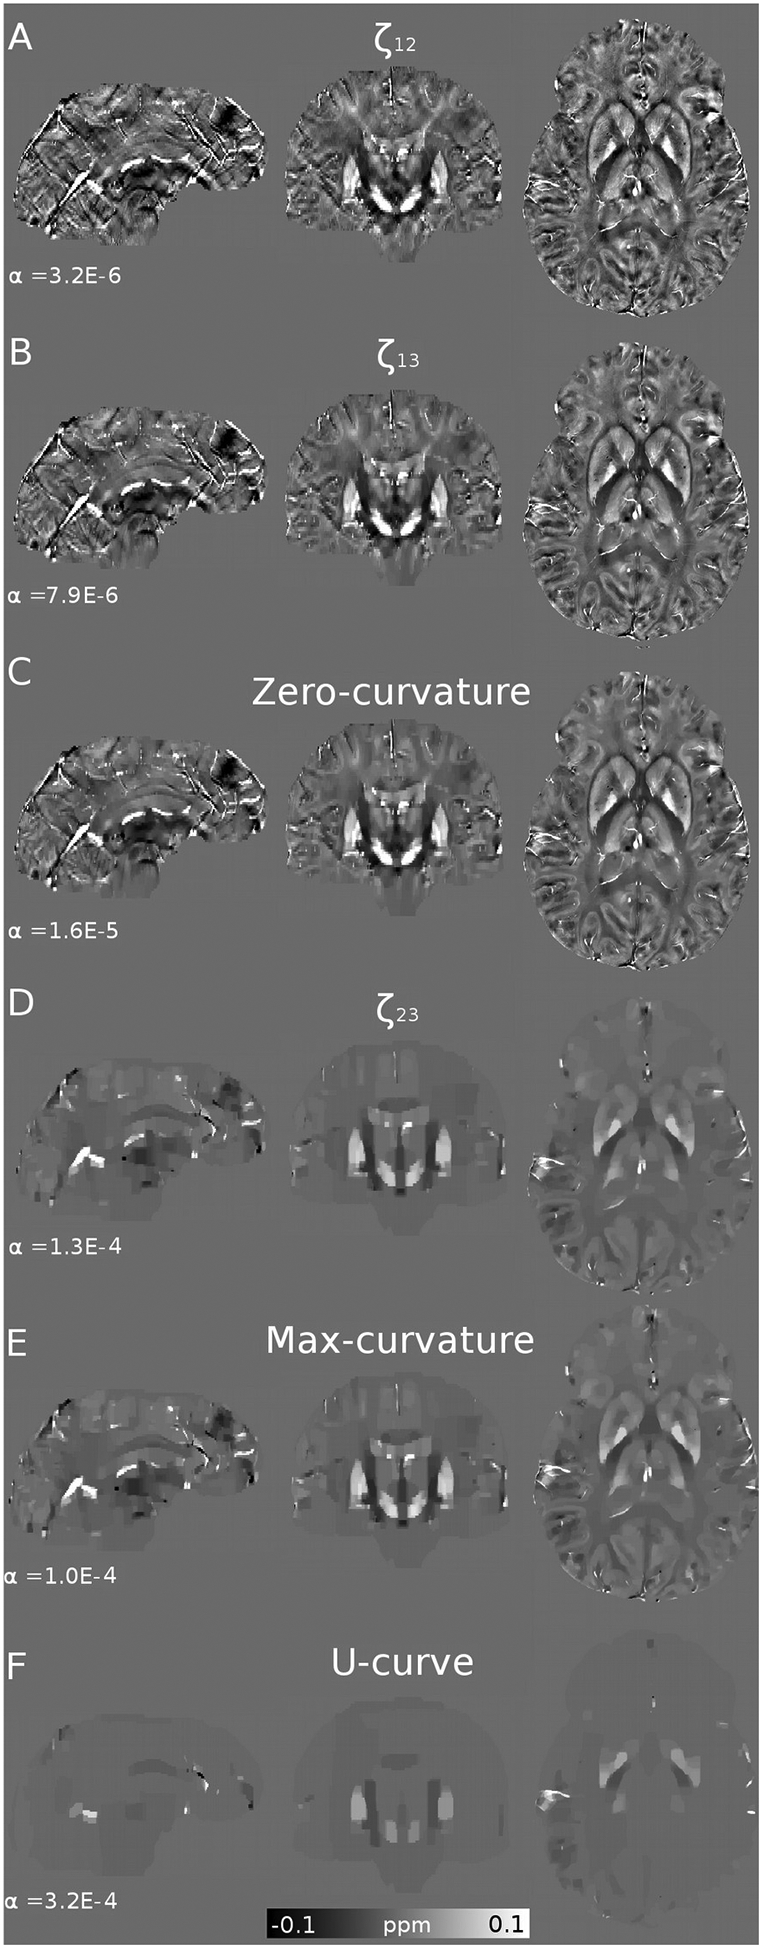
Optimal reconstructions and regularizations weights (α) of the 7T Siemens in vivo data, using the Frequency (A, B, E), L-curve (B, C) and U-curve analysis (D).
Official websites use .gov
A
.gov website belongs to an official
government organization in the United States.
Secure .gov websites use HTTPS
A lock (
) or https:// means you've safely
connected to the .gov website. Share sensitive
information only on official, secure websites.
Optimal reconstructions and regularizations weights (α) of the 7T Siemens in vivo data, using the Frequency (A, B, E), L-curve (B, C) and U-curve analysis (D).