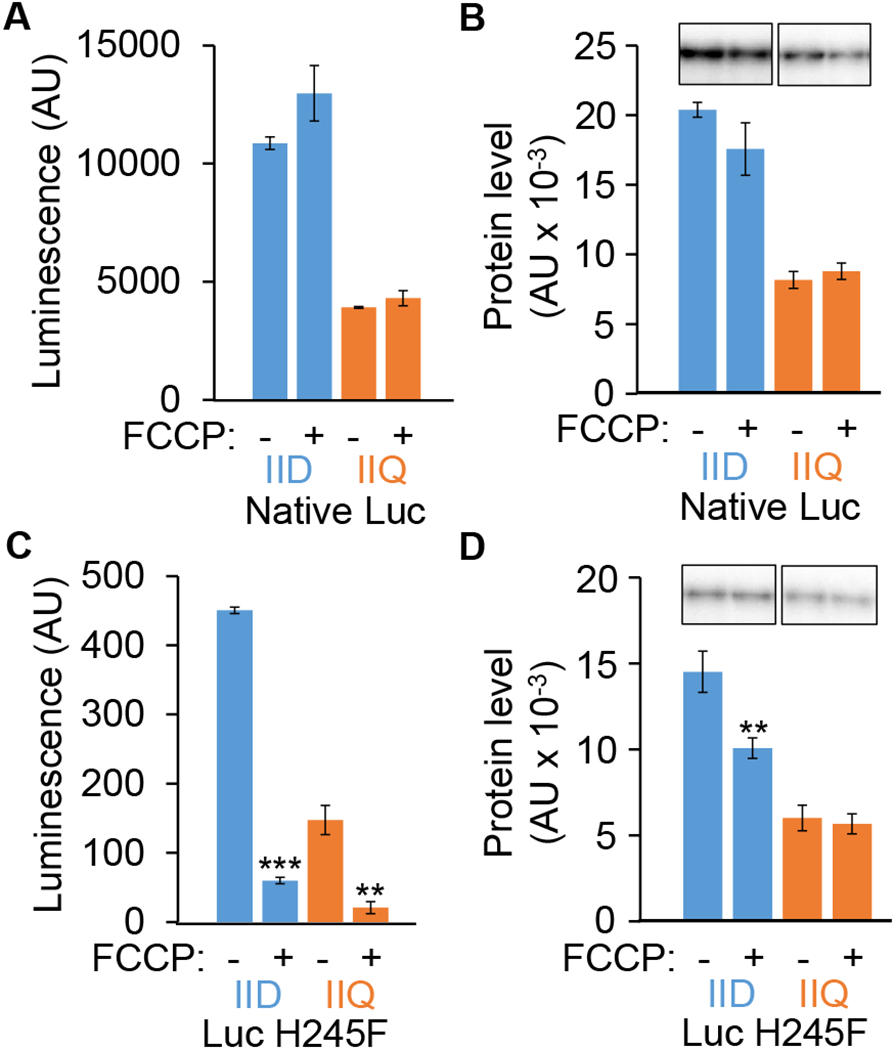
Fig. 2. Luc H245F detects decreases in compartment-specific luminescence intensity after FCCP treatment during sporulation.

B. subtilis strains engineered to express the genes encoding native Luc or Luc H245F in the MC or FS were starved to induce sporulation. At 3.5 h PS, culture aliquots were transferred to a 96-well plate containing luciferin. Aliquots were left untreated as controls (−) or were treated with 100 μM FCCP (+) for 15 min, prior to measuring the luminescence intensity in arbitrary units (AU) and the Luc level in AU by immunoblot analysis with anti-Luc antibodies. Each Luc signal was quantified and normalized to a control sample on the same blot. Graphs show the average of three biological replicates and error bars represent one standard deviation. Two asterisks (**) indicate P < 0.005 and three asterisks (***) indicate P < 0.0005 in paired two-tailed t-tests comparing the data for the untreated control with the FCCP-treated sample. Luminescence intensity from native Luc (A) and Luc H245F (C). Levels of native Luc (B) and Luc H245F (D). Representative immunoblots are shown at the top and quantification of replicates is shown below.
