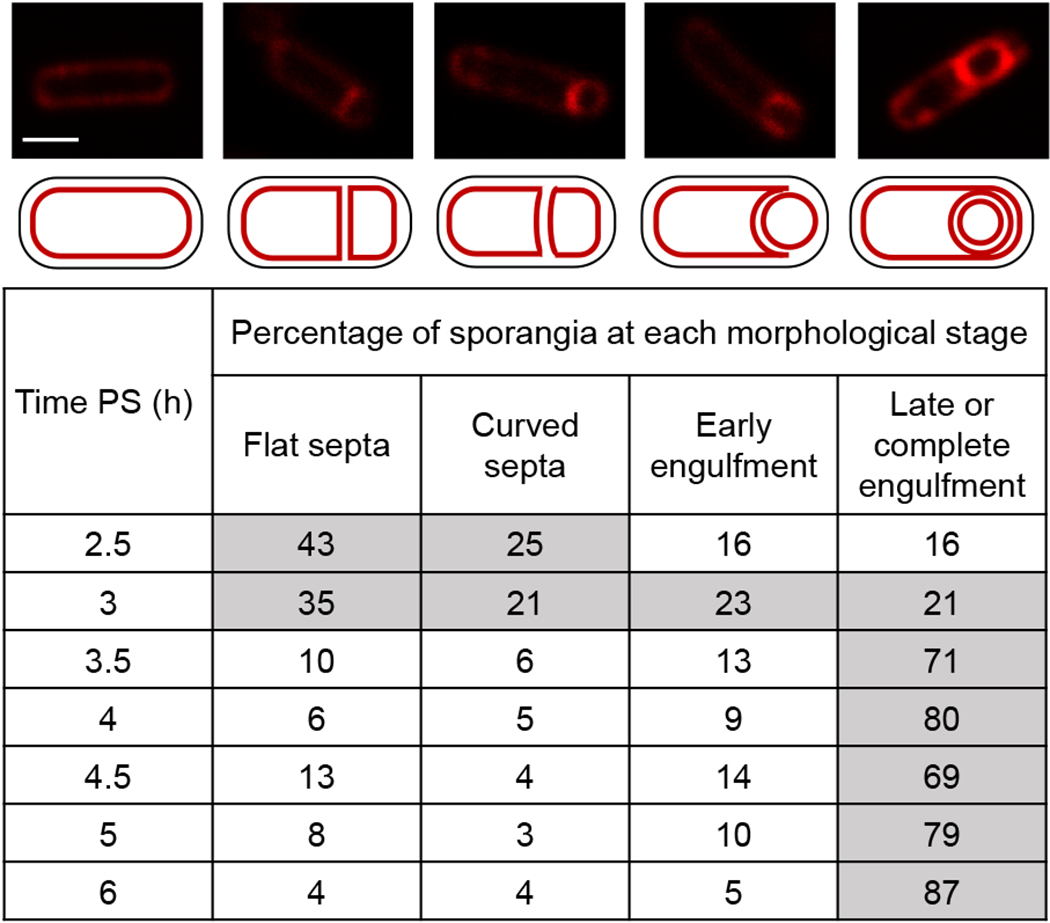
Fig. 4. Morphological changes during sporulation.

B. subtilis strains engineered to produce Luc H245F in the MC or FS were starved to induce sporulation. At 2 h PS, culture aliquots were transferred to a 96-well plate containing FM 4-64 to stain membranes. Images were collected at the indicated times PS using confocal fluorescence microscopy. A representative rod-shaped cell (top, left panel; scale bar = 1 μm) and sporangia representative of each stage (top row; same scale) are shown, with cartoon depictions of their membranes below. The percentage of sporangia (150-250 counted; rod-shaped cells were not counted) at each morphological stage is listed at each time PS for the strain producing Luc H245F in the MC. Gray fill indicates > 20%. Similar results were observed for the strain engineered to produce Luc H245F in the FS, and for the WT parental strain PY79 that does not produce Luc H245F.
