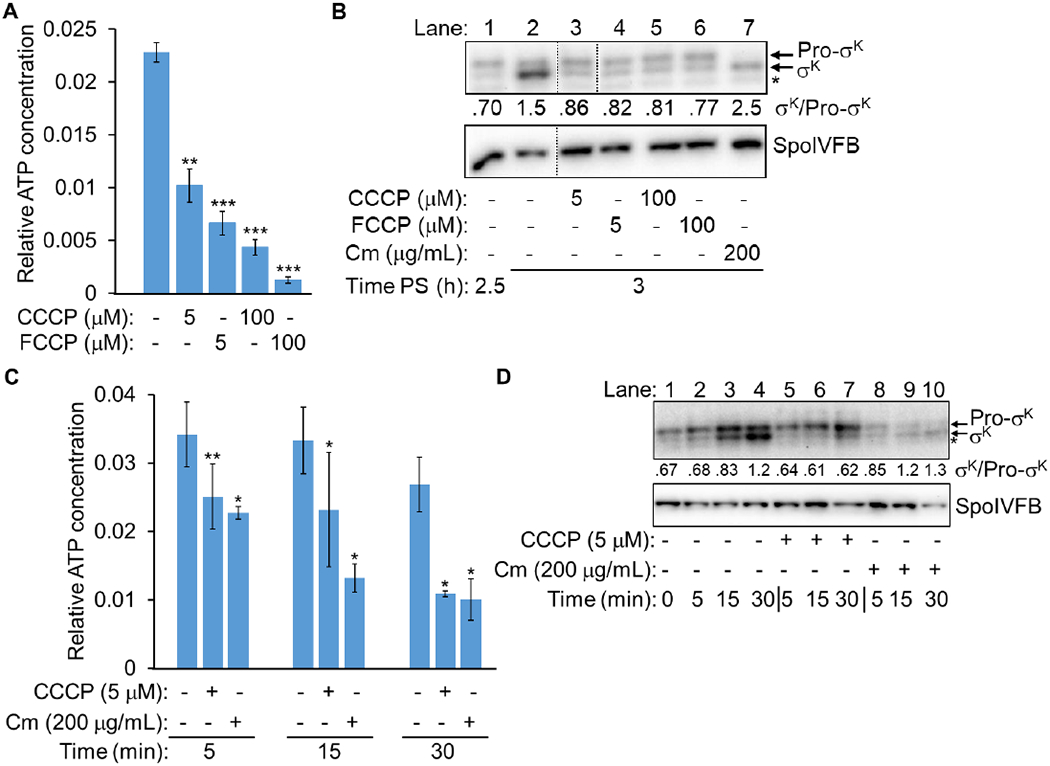
Fig. 9. Ionophores and chloramphenicol decrease the mother cell ATP concentration but allow Pro-σK cleavage.

(A) Relative ATP concentration in the MC after ionophore treatment. B. subtilis engineered to synthesize Luc H245F in the MC was starved to induce sporulation. At 3.5 h PS, culture aliquots were transferred to a 96-well plate containing luciferin. Aliquots were left untreated as controls (−) or were treated with an ionophore as indicated for 15 min, prior to measuring the luminescence intensity and the Luc H245F level by immunoblot analysis with anti-Luc antibodies (Fig. S11). For each biological replicate, the luminescence intensity was divided by the Luc H245F level to yield a normalized value representing the relative ATP concentration. The graph shows the average of three or four biological replicates and error bars represent one standard deviation. Two asterisks (**) indicate P < 0.005 and three asterisks (***) indicate P < 0.0005 in paired two-tailed t-tests comparing the data for the untreated control with the treated sample. (B) Cleavage of Pro-σK after ionophore or Cm treatment. B. subtilis with a null mutation in sigG and the bofB8 mutation that bypasses the need for sigG (Cutting et al., 1990) was starved to induce sporulation. At 2.25 h PS, the culture was split, and at 2.5 h, the cultures were left untreated as a control (−) or were treated with an ionophore or Cm as indicated until 3 h. Samples were subjected to immunoblot analysis with antibodies against Pro-σK and SpoIVFB. A representative immunoblot is shown (dotted lines indicate intervening lanes were removed from the blot). The asterisk indicates a breakdown product of Pro-σK or a cross-reactive protein. The σK and Pro-σK signal intensities were quantified (Table S1) and the ratio is shown. Similar results were observed for at least two biological replicates. (C) Relative ATP concentration in the MC after CCCP or Cm treatment. The experiment was performed as described for panel A, except at 2.5 h (to match panel B), aliquots were transferred to a 96-well plate containing luciferin. Aliquots were left untreated as controls (−) or were treated with CCCP or Cm as indicated for 5, 15, or 30 min, prior to measuring the luminescence intensity and the Luc H245F level (Fig. S13). For each biological replicate, the luminescence intensity was divided by the Luc H245F level to yield a normalized value representing the relative ATP concentration. The graph shows the average of three biological replicates and error bars represent one standard deviation. One asterisk (*) indicates P ≤ 0.05 and two asterisks (**) indicate P < 0.005 in paired two-tailed t-tests comparing the data for the untreated control with the sample treated for the same amount of time. (D) Cleavage of Pro-σK after CCCP or Cm treatment. The experiment was performed as described for panel B, except cultures were left untreated as a control (−) or were treated as indicated for 5, 15, or 30 min.
