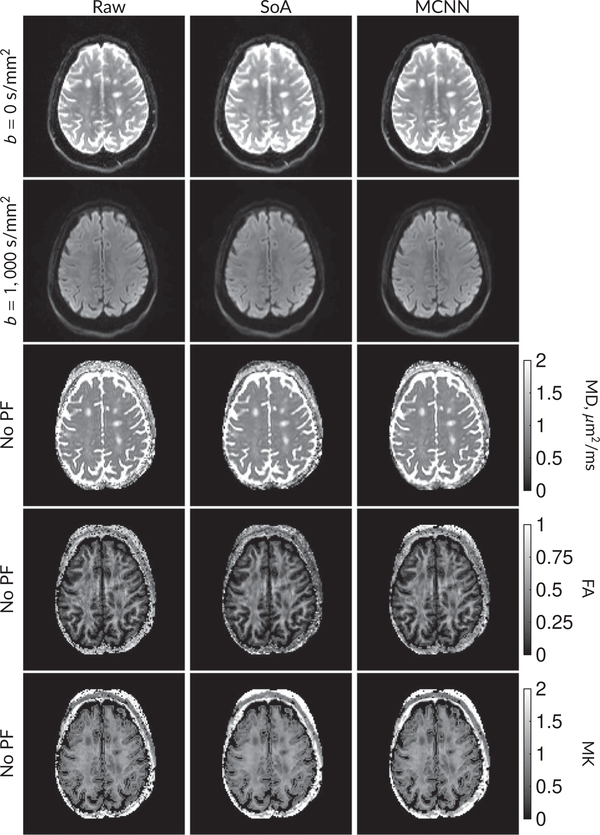
FIGURE 10.
Parameter maps calculated for a patient with multiple sclerosis. MS lesions are visible in all three parameter maps. Both the SoA and magnitude-input CNN (MCNN) methods are able to denoise parameter maps relative to the original (Raw) data. Images zoomed on the lesions are shown in the Supporting Information

