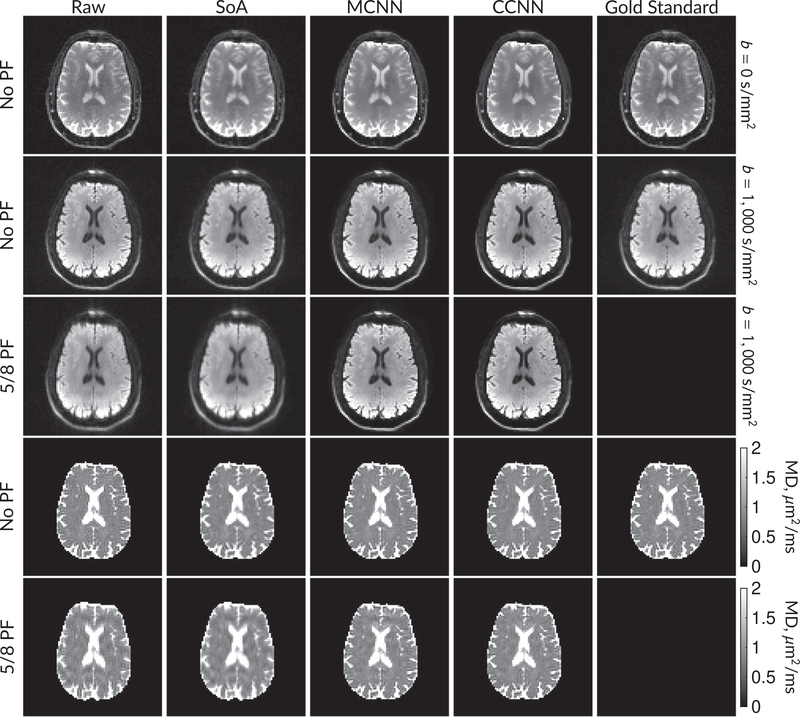
FIGURE 5.
DW and MD images from various methods performed on segmented EPI data. At the top are shown the b = 0 s/mm2 and averaged b = 1000 s/mm2 images from Raw, SoA, MCNN, and CCNN methods. The final column shows the “gold standard,” results from apodizing the full segmented EPI data set and cropping. Comparisons with and without partial Fourier are shown for b = 1000 s/mm2 images and mean diffusivity images. Partial Fourier artifacts are mitigated in the CNN methods

